Greater Baton Rouge Existing Home Sales Home Prices February 2013 vs Feb 2014
•
0 gostou•209 visualizações

The median sold home price in February 2014 was down 2% from February 2013. The number of homes sold increased 8% while the number of homes for sale decreased 5%. The average days on market for homes decreased in this period.

Recomendados
Recomendados
Mais conteúdo relacionado
Mais procurados
Mais procurados (20)
Destaque
Destaque (20)
Semelhante a Greater Baton Rouge Existing Home Sales Home Prices February 2013 vs Feb 2014
Semelhante a Greater Baton Rouge Existing Home Sales Home Prices February 2013 vs Feb 2014 (13)
Mais de Bill Cobb, Appraiser
Mais de Bill Cobb, Appraiser (20)
Último
Último (20)
Greater Baton Rouge Existing Home Sales Home Prices February 2013 vs Feb 2014
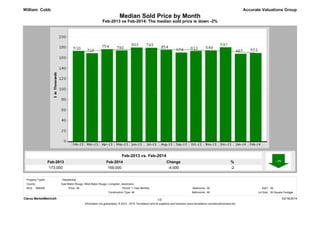
- 1. Median Sold Price by Month Feb-2013 vs Feb-2014: The median sold price is down -2% Feb-2014 169,000 Feb-2013 173,000 % -2 Change -4,000 Accurate Valuations Group Feb-2013 vs. Feb-2014 William Cobb Property Types: : Residential MLS: GBRAR Bedrooms: 1 Year Monthly All SqFt: All All Bathrooms: All Lot Size: All Square Footage All Period: Construction Type: Clarus MarketMetrics® 03/16/2014 1/2 Information not guaranteed. © 2014 - 2015 Terradatum and its suppliers and licensors (www.terradatum.com/about/licensors.td). County: East Baton Rouge, West Baton Rouge, Livingston, Ascension Price:
- 2. William Cobb Accurate Valuations Group Median Sold Price by Month Feb-2013 vs Feb-2014: The median sold price is down -2% Time Period Sold Median Price Units Avg DOM Feb-14 169,000 553 94 Jan-14 167,500 487 89 Dec-13 179,900 597 81 Nov-13 174,000 549 82 Oct-13 172,900 613 86 Sep-13 169,900 674 80 Aug-13 175,025 854 80 Jul-13 179,000 793 76 Jun-13 179,500 803 81 May-13 174,000 793 90 Apr-13 176,250 754 92 Mar-13 168,547 716 91 Feb-13 173,000 510 106 2/2 Clarus MarketMetrics® 03/16/2014 Information not guaranteed. © 2014 - 2015 Terradatum and its suppliers and licensors (www.terradatum.com/about/licensors.td).
- 3. Accurate Valuations Group Feb-2013 vs Feb-2014: The median price of for sale properties is up 3% and the median price of sold properties is down -2% Feb-2013 vs. Feb-2014 William Cobb Feb-2014 169,900 175,000 3 Median For Sale vs Median Sold Feb-2013 Change % 5,100 Feb-2013 vs. Feb-2014 Feb-2013 Feb-2014 Change % 173,000 169,000 -4,000 -2 Property Types: : Residential MLS: GBRAR Bedrooms: 1 Year Monthly All SqFt: All All Bathrooms: All Lot Size: All Square Footage All Period: Construction Type: Clarus MarketMetrics® 1/2 03/16/2014 Information not guaranteed. © 2014 - 2015 Terradatum and its suppliers and licensors (www.terradatum.com/about/licensors.td). County: East Baton Rouge, West Baton Rouge, Livingston, Ascension Price:
- 4. William Cobb Accurate Valuations Group Median For Sale vs Median Sold Feb-2013 vs Feb-2014: The median price of for sale properties is up 3% and the median price of sold properties is down -2% For Sale # Properties Sold # Properties Price Difference Time Period Median For Sale Median Sold Feb-14 175,000 4,477 169,000 553 -6,000 Jan-14 174,900 4,539 167,500 487 -7,400 Dec-13 171,825 4,490 179,900 597 8,075 Nov-13 173,720 4,734 174,000 549 280 Oct-13 173,900 4,978 172,900 613 -1,000 Sep-13 170,000 4,910 169,900 674 -100 Aug-13 171,350 4,982 175,025 854 3,675 Jul-13 173,900 4,996 179,000 793 5,100 Jun-13 174,500 4,963 179,500 803 5,000 May-13 174,900 4,976 174,000 793 -900 Apr-13 172,500 4,956 176,250 754 3,750 Mar-13 169,900 4,922 168,547 716 -1,353 Feb-13 169,900 4,697 173,000 510 3,100 Clarus MarketMetrics® 2/2 03/16/2014 Information not guaranteed. © 2014 - 2015 Terradatum and its suppliers and licensors (www.terradatum.com/about/licensors.td).
- 5. Sold Properties by Month Feb-2013 vs Feb-2014: The number of Sold properties is up 8% Feb-2014 553 Feb-2013 510 % 8 Change 43 Accurate Valuations Group Feb-2013 vs. Feb-2014 William Cobb Property Types: : Residential MLS: GBRAR Bedrooms: 1 Year Monthly All SqFt: All All Bathrooms: All Lot Size: All Square Footage All Period: Construction Type: Clarus MarketMetrics® 1/2 03/16/2014 Information not guaranteed. © 2014 - 2015 Terradatum and its suppliers and licensors (www.terradatum.com/about/licensors.td). County: East Baton Rouge, West Baton Rouge, Livingston, Ascension Price:
- 6. William Cobb Accurate Valuations Group Sold Properties by Month Feb-2013 vs Feb-2014: The number of Sold properties is up 8% Time Period Units Median Price Avg DOM Feb-14 553 169,000 94 Jan-14 487 167,500 89 Dec-13 597 179,900 81 Nov-13 549 174,000 82 Oct-13 613 172,900 86 Sep-13 674 169,900 80 Aug-13 854 175,025 80 Jul-13 793 179,000 76 Jun-13 803 179,500 81 May-13 793 174,000 90 Apr-13 754 176,250 92 Mar-13 716 168,547 91 Feb-13 510 173,000 106 Clarus MarketMetrics® 2/2 03/16/2014 Information not guaranteed. © 2014 - 2015 Terradatum and its suppliers and licensors (www.terradatum.com/about/licensors.td).
- 7. Under Contract Properties by Month Feb-2013 vs Feb-2014: The number of Under Contract properties is up 10% Feb-2014 707 Feb-2013 642 % 10 Change 65 Accurate Valuations Group Feb-2013 vs. Feb-2014 William Cobb Bathrooms: All SqFt: All East Baton Rouge, West Baton Rouge, Livingston, Ascension Property Types: Clarus MarketMetrics® 1/2 03/16/2014 Information not guaranteed. © 2014 - 2015 Terradatum and its suppliers and licensors (www.terradatum.com/about/licensors.td). : Residential GBRAR Period: 1 Year Monthly Construction Type: Lot Size: All Square Footage Price: MLS: All All All Bedrooms: County:
- 8. William Cobb Accurate Valuations Group Under Contract Properties by Month Feb-2013 vs Feb-2014: The number of Under Contract properties is up 10% Time Period Units Median Price Avg DOM Feb-14 707 179,900 92 Jan-14 659 175,900 105 Dec-13 463 171,900 88 Nov-13 543 185,000 85 Oct-13 648 175,900 80 Sep-13 576 179,900 90 Aug-13 700 174,950 80 Jul-13 731 180,000 83 Jun-13 728 175,000 78 May-13 785 179,900 82 Apr-13 832 178,400 83 Mar-13 817 180,000 92 Feb-13 642 175,000 92 Clarus MarketMetrics® 2/2 03/16/2014 Information not guaranteed. © 2014 - 2015 Terradatum and its suppliers and licensors (www.terradatum.com/about/licensors.td).
- 9. New Properties by Month Feb-2013 vs Feb-2014: The number of New properties is down -1% Feb-2014 930 Feb-2013 939 % -1 Change -9 Accurate Valuations Group Feb-2013 vs. Feb-2014 William Cobb Property Types: : Residential MLS: GBRAR Bedrooms: 1 Year Monthly All SqFt: All All Bathrooms: All Lot Size: All Square Footage All Period: Construction Type: Clarus MarketMetrics® 1/2 03/16/2014 Information not guaranteed. © 2014 - 2015 Terradatum and its suppliers and licensors (www.terradatum.com/about/licensors.td). County: East Baton Rouge, West Baton Rouge, Livingston, Ascension Price:
- 10. William Cobb Accurate Valuations Group New Properties by Month Feb-2013 vs Feb-2014: The number of New properties is down -1% Time Period Units Median Price Feb-14 930 179,900 Jan-14 893 183,000 Dec-13 614 175,000 Nov-13 739 172,000 Oct-13 980 181,950 Sep-13 1,006 169,500 Aug-13 1,070 179,000 Jul-13 1,094 173,500 Jun-13 1,072 179,000 May-13 1,153 180,000 Apr-13 1,174 180,000 Mar-13 1,130 175,000 Feb-13 939 171,000 Clarus MarketMetrics® 2/2 03/16/2014 Information not guaranteed. © 2014 - 2015 Terradatum and its suppliers and licensors (www.terradatum.com/about/licensors.td).
- 11. For Sale Properties by Month Feb-2013 vs Feb-2014: The number of For Sale properties is down -5% Feb-2014 4,477 Feb-2013 4,697 % -5 Change -220 Accurate Valuations Group Feb-2013 vs. Feb-2014 William Cobb Property Types: : Residential MLS: GBRAR Bedrooms: 1 Year Monthly All SqFt: All All Bathrooms: All Lot Size: All Square Footage All Period: Construction Type: Clarus MarketMetrics® 1/2 03/16/2014 Information not guaranteed. © 2014 - 2015 Terradatum and its suppliers and licensors (www.terradatum.com/about/licensors.td). County: East Baton Rouge, West Baton Rouge, Livingston, Ascension Price:
- 12. William Cobb Accurate Valuations Group For Sale Properties by Month Feb-2013 vs Feb-2014: The number of For Sale properties is down -5% Time Period Units Median Price Avg DOM Feb-14 4,477 175,000 147 Jan-14 4,539 174,900 152 Dec-13 4,490 171,825 157 Nov-13 4,734 173,720 145 Oct-13 4,978 173,900 136 Sep-13 4,910 170,000 135 Aug-13 4,982 171,350 137 Jul-13 4,996 173,900 139 Jun-13 4,963 174,500 139 May-13 4,976 174,900 140 Apr-13 4,956 172,500 140 Mar-13 4,922 169,900 146 Feb-13 4,697 169,900 151 Clarus MarketMetrics® 2/2 03/16/2014 Information not guaranteed. © 2014 - 2015 Terradatum and its suppliers and licensors (www.terradatum.com/about/licensors.td).
- 13. Expired Properties by Month Feb-2013 vs Feb-2014: The number of Expired properties is up 11% Feb-2014 292 Feb-2013 263 % 11 Change 29 Accurate Valuations Group Feb-2013 vs. Feb-2014 William Cobb Property Types: : Residential County: East Baton Rouge, West Baton Rouge, Livingston, Ascension MLS: GBRAR Bedrooms: 1 Year Monthly All SqFt: All All Bathrooms: All Lot Size: All Square Footage All Period: Construction Type: Price: Clarus MarketMetrics® 1/2 03/16/2014
- 14. William Cobb Accurate Valuations Group Expired Properties by Month Feb-2013 vs Feb-2014: The number of Expired properties is up 11% Units Median Price Avg DOM Feb-14 292 161,950 194 Jan-14 333 169,900 185 Dec-13 381 174,000 221 Nov-13 315 179,900 179 Oct-13 335 164,000 175 Sep-13 336 164,450 180 Aug-13 378 158,000 212 Jul-13 353 187,500 220 Jun-13 333 168,500 184 May-13 300 169,450 185 Apr-13 301 164,900 172 Mar-13 323 151,000 197 Feb-13 263 179,000 196 Clarus MarketMetrics® 2/2 03/16/2014 Information not guaranteed. © 2014 - 2015 Terradatum and its suppliers and licensors (www.terradatum.com/about/licensors.td).
- 15. Accurate Valuations Group Feb-2013 vs Feb-2014: The number of for sale properties is down -5% and the number of sold properties is up 8% Feb-2013 vs. Feb-2014 William Cobb Feb-2014 4,697 4,477 -5 Supply & Demand by Month Feb-2013 Change % -220 Feb-2013 vs. Feb-2014 Feb-2013 Feb-2014 % 510 553 8 Change 43 Property Types: : Residential MLS: GBRAR Bedrooms: 1 Year Monthly All SqFt: All All Bathrooms: All Lot Size: All Square Footage All Period: Construction Type: Clarus MarketMetrics® 1/2 03/16/2014 Information not guaranteed. © 2014 - 2015 Terradatum and its suppliers and licensors (www.terradatum.com/about/licensors.td). County: East Baton Rouge, West Baton Rouge, Livingston, Ascension Price:
- 16. William Cobb Accurate Valuations Group Supply & Demand by Month Feb-2013 vs Feb-2014: The number of for sale properties is down -5% and the number of sold properties is up 8% # Properties # Properties Time Period For Sale Sold Feb-14 4,477 147 553 94 Jan-14 4,539 152 487 89 Dec-13 4,490 157 597 81 Nov-13 4,734 145 549 82 Oct-13 4,978 136 613 86 Sep-13 4,910 135 674 80 Aug-13 4,982 137 854 80 Jul-13 4,996 139 793 76 Jun-13 4,963 139 803 81 May-13 4,976 140 793 90 Apr-13 4,956 140 754 92 Mar-13 4,922 146 716 91 Feb-13 4,697 151 510 106 Avg DOM Avg DOM Clarus MarketMetrics® 2/2 03/16/2014 Information not guaranteed. © 2014 - 2015 Terradatum and its suppliers and licensors (www.terradatum.com/about/licensors.td).
- 17. The Average Days on Market by Month Feb-2013 vs Feb-2014: The average days on market is down -1% Feb-2014 92 Feb-2013 92 % -1 Change -1 Accurate Valuations Group Feb-2013 vs. Feb-2014 William Cobb Property Types: : Residential East Baton Rouge, West Baton Rouge, Livingston, Ascension All 1 Year Monthly County: Price: Period: Bedrooms: All SqFt: All All Square Footage Construction Type: All Bathrooms: All Lot Size: MLS: GBRAR Clarus MarketMetrics® 1/2 03/16/2014
- 18. William Cobb Accurate Valuations Group The Average Days on Market by Month Feb-2013 vs Feb-2014: The average days on market is down -1% Time Period Avg DOM # UC Units Feb-14 92 707 Jan-14 105 659 Dec-13 88 463 Nov-13 85 543 Oct-13 80 648 Sep-13 90 576 Aug-13 80 700 Jul-13 83 731 Jun-13 78 728 May-13 82 785 Apr-13 83 832 Mar-13 92 817 Feb-13 92 642 Clarus MarketMetrics® 2/2 03/16/2014 Information not guaranteed. © 2014 - 2015 Terradatum and its suppliers and licensors (www.terradatum.com/about/licensors.td).
- 19. Feb-2013 vs Feb-2014: The average months supply of inventory is down -17% Accurate Valuations Group Feb-2013 vs. Feb-2014 Feb-2014 5.9 -17 William Cobb 4.9 Months Supply of Inventory Feb-2013 Change % -1 Property Types: : Residential MLS: GBRAR Bedrooms: 1 Year Monthly All SqFt: All All Bathrooms: All Lot Size: All Square Footage All Period: Construction Type: Clarus MarketMetrics® 03/16/2014 1/2 Information not guaranteed. © 2014 - 2015 Terradatum and its suppliers and licensors (www.terradatum.com/about/licensors.td). County: East Baton Rouge, West Baton Rouge, Livingston, Ascension Price:
- 20. William Cobb Accurate Valuations Group Months Supply of Inventory Feb-2013 vs Feb-2014: The average months supply of inventory is down -17% # Units For Sale # UC Units Last Day of Month During Month MSI Time Period UC Avg DOM Feb-14 3,478 707 4.9 92 Jan-14 3,547 659 5.4 105 Dec-13 3,646 463 7.9 88 Nov-13 3,876 543 7.1 85 Oct-13 3,995 648 6.2 80 Sep-13 3,998 576 6.9 90 Aug-13 3,904 700 5.6 80 Jul-13 3,912 731 5.4 83 Jun-13 3,902 728 5.4 78 May-13 3,891 785 5.0 82 Apr-13 3,823 832 4.6 83 Mar-13 3,782 817 4.6 92 Feb-13 3,792 642 5.9 92 Clarus MarketMetrics® 03/16/2014 2/2 Information not guaranteed. © 2014 - 2015 Terradatum and its suppliers and licensors (www.terradatum.com/about/licensors.td).