SlideShare uma empresa Scribd logo
1 de 6
Baixar para ler offline
Food Price Watch
                                                                                                  POVERTY REDUCTION AND EQUITY GROUP
                                                                          POVERTY REDUCTION AND ECONOMIC MANAGEMENT (PREM) NETWORK
                                                                                                                    THE WORLD BANK

                                                                                                                                                          FEBRUARY 2011


 Global food prices continue to rise. The World Bank’s food price index increased by 15% between October 2010 and
 January 2011 and is only 3% below its 2008 peak. The last six months have seen sharp increases in the global prices of
 wheat, maize, sugar and edible oils, with a relatively smaller increase in rice prices. Higher global wheat prices have
 fed into significant increases in local wheat prices in many countries. Higher maize, sugar, and oil prices have
 contributed to increase the costs of various types of food, though local maize prices have largely been stable in Sub-
 Saharan Africa. Local rice prices have increased in line with global prices in some large rice-consuming Asian countries.
 These food price rises create macro vulnerabilities, particularly for countries with a high share of food imports and
 limited fiscal space, as well as increases in poverty. Estimates of those who fall into, and move out of, poverty as a result
 of price rises since June 2010 show there is a net increase in extreme poverty of about 44 million people in low- and
 middle-income countries. In the immediate term, it is important to ensure that further increases in poverty are
 curtailed by taking measures that calm jittery markets and by scaling up safety net and nutritional programs.
 Investments in raising environmentally sustainable agricultural productivity, better risk-management tools, less food-
 intensive biofuel technologies, and climate change adaptation measures are all necessary over the medium term to
 mitigate the impact of expected food price volatility on the most vulnerable.


Global food prices continue to rise, though not                                        side, there is uncertainty about the size and the quality
uniformly for all grains. The World Bank’s food price                                  of wheat exports from Australia—where crops were
index rose by 15% between October 2010 and January                                     damaged by excessive rains and floods—as well as
2011, is 29% above its level a year earlier, and only 3%                               concerns about China’s winter wheat crop. Demand
below its June 2008 peak (figure 1). A breakdown of the
index shows that the grain price index remains 16%                                     Figure 1. World Bank Food Price Indices
below its peak mainly due to relatively stable rice prices,
which are significantly lower than in 2008. The increase
over the last quarter is driven largely by increases in the
price of sugar (20%), fats and oils (22%), wheat (20%),
and maize (12%).
   Among grains, global wheat prices have increased
the most in recent months. A confluence of weather
shocks to various large producing countries, followed in
some cases by export restrictions, curtailed supply and
caused wheat prices to more than double between the
lows of June 2010 and January 2011 (figure 2). Currently
two factors are keeping wheat prices high. On the supply
                                                                                       Source: World Bank Development Prospects Group.


               Food Price Watch, produced by the Poverty Reduction and Equity group at the World Bank, is a series that aims at drawing attention to trends
                in domestic food prices in low- and middle-income countries and their policy implications. Contact: Hassan Zaman (hzaman@worldbank.org)
Figure 2. Global Prices of Key Food                         the impact of global price rises as prices of nonsubsidized
Commodities                                                 wheat products, as well as other basic staples, have
                                                            increased. Local practices have also shielded consumers
                                                            from higher global wheat prices—for instance in
                                                            Cambodia bread prices have remained stable as
                                                            consumers use flour made from locally produced cassava.
                                                                Maize prices have increased sharply and are affected
                                                            by complex linkages with other markets. In January
                                                            2011, maize prices were about 73% higher than June
                                                            2010. These increases are due to a series of downward
                                                            revisions of crop forecasts, low stocks (U.S. stocks-to-use
                                                            ratio for 2010/11 is projected to be 5%, the lowest since
                                                            1995), the positive relationship between maize and
                                                            wheat prices, and the use of corn for biofuels. Ethanol
                                                            production demand for corn increases as oil prices go
                                                            up, with sugar-based ethanol less competitive at current
Source: World Bank Development Prospects Group.             sugar prices. Recent United States Department of
                                                            Agriculture (USDA) estimates show the share of ethanol
drivers center around the possibility of large wheat-       for fuel rising from 31% of U.S. corn output in 2008/9
importing countries, particularly in the Middle East and    to a projected 40% in 2010/11. Increased demand for
North Africa, coming to the market with large orders.       high fructose corn syrup from countries such as Mexico,
These are related to assuring the public that adequate      as they substitute away from higher priced sugar, also
domestic food stocks exist during uncertain political       contributes to higher demand for corn. Prospects of
times in some countries. Another reason is that countries   easing in this market depend partly on the size of the
like Saudi Arabia are progressively reducing domestic       crops in Latin America, particularly Argentina, which
production of wheat to conserve valuable water              has been affected by unusually dry weather due to the
resources and relying more on imports.                      La Nina effect, and the extent of import demand from
    Higher global wheat prices have fed into sharp          China in 2011 as well as oil and sugar price trajectories.
increases in domestic wheat prices in many countries.           The transmission of higher global maize prices is
The transmission rate of global wheat price increases to    varied and has depended significantly on domestic
the domestic price of wheat-related products has been       harvest conditions. Countries in Sub-Saharan Africa
high in many countries. For instance, between June          have benefitted from excellent maize harvests, which
2010 and December 2010, the price of wheat increased        have led to a sharp fall in prices. The declines from
by large amounts in Kyrgyzstan (54%), Bangladesh            June–December 2010 shown in table 1 come on the
(45%), Tajikistan (37%), Mongolia (33%), Sri Lanka          heels of even sharper price falls in the early part of the
(31%), Azerbaijan (24%), Afghanistan (19%), Sudan           year—on average, maize prices were lower in 2010 in
(16%), and Pakistan (16%). Several of these countries       comparison to 2009 in Uganda (52%), Rwanda (37%),
have a large share of calories consumed from wheat-         Kenya (33%), Malawi (30%), Ethiopia (22%), and
based products, particularly for the poor (table 1).        Tanzania (19%).1 However, these prices also exhibit
    In several other countries, the adjustment to higher    considerable volatility, which has adverse impacts on
global wheat prices has been shared by the government       both producers and consumers. For instance, after a
and consumers. In India, higher domestic procurement        sharp decline in the early part of 2010, maize prices in
prices for wheat have contributed to record domestic        Rwanda have rebounded by 19% since June 2010.
grain stocks, which have been released to curb prices. In   Several Latin American countries saw the price of maize
parallel, the subsidized wheat program has been scaled      rise dramatically in the last half of 2010 as dry weather
up. In Egypt, the bread subsidy is estimated to reach       lowered yields—the largest increases were witnessed in
around 85% of the population. Nevertheless, even in         Brazil (56%) and Argentina (40%). Higher global maize
these countries, consumers are not fully exempted from      1
                                                                The prices for Uganda, Rwanda, Kenya and Tanzania are in U.S. dollars.


POVERTY REDUCTION & EQUITY GROUP • WWW.WORLDBANK.ORG/POVERTY
POVERTY REDUCTION AND ECONOMIC MANAGEMENT (PREM) NETWORK
THE WORLD BANK GROUP                                                                                                                     2
Table 1. Largest Movers in Domestic Prices, June to December 2010
                                                               Change        Calorie                                  Change     Calorie
                                                               in price       share                                   in price    share
 Product by country                                              (%)           (%)     Product by country               (%)        (%)
 Wheat                                                                                 Rice
 World price (US$, HRW U.S.                                                            World price (US$, 5% Thai,
                                                                       75                                               17
 Gulf Ports)                                                                           Bangkok)
 Kyrgyzstan (retail, Bishkek)                                          54      40      Vietnam (retail, Dong Thap)      46         59
 Bangladesh (retail, national
                                                                       45      6       Burundi (retail, Bujumbura)      41         3
 average)
 Tajikistan (retail, national
                                                                       37      54      Bangladesh (retail, Dhaka)       19         70
 average)
 Mongolia (retail,
                                                                       33      42      Pakistan (retail, Lahore)        19         6
 Ulaanbaatar)
                                                                                       Indonesia (retail, national
 Sri Lanka (retail, Colombo)                                           31      14                                       19         50
                                                                                       average)
 Azerbaijan (retail, national
                                                                       24      57      Mozambique (retail, Maputo)      14         8
 average)
                                                                                       Cambodia (wholesale,
 Afghanistan (retail, Kabul)                                           19      ..                                       -11        65
                                                                                       Phnom Penh)
 Sudan (wholesale,                                                                     Mexico (wholesale, Mexico
                                                                       16      15                                        -9        2
 Khartoum)                                                                             City)
 Pakistan (retail, Lahore)                                             16      37      Maize
 Brazil (wholesale, São                                                                World price (US$, U.S. Gulf
                                                                       14      13                                       73
 Paulo)                                                                                Ports)
 Bolivia (wholesale, La Paz)                                           10      18      Brazil (wholesale São Paulo)     56         7
                                                                                       Argentina (wholesale,
 Cameroon (retail, Yaounde)                                            -15     6                                        40         3
                                                                                       Rosario)
 Sorghum                                                                               Rwanda (wholesale, Kigali)a      19         5
                                                                                       Peru (wholesale, national
 World price                                                           88                                               12         11
                                                                                       average)
                                                                                       Guatemala (retail, national
 Somalia (retail, Mogadishu)                                           26      ..                                        8         40
                                                                                       average)
 Sudan (wholesale,
                                                                       -37     26      Kenya (wholesale, Nairobi)a       -8        35
 Khartoum)
                                                                                       Ethiopia (wholesale, Addis
 Mali (wholesale, Bamako)                                              -13     13                                        -8        21
                                                                                       Ababa)
 Beans                                                                                 Moldova (retail, Chisinau)        -8        22
 Burundi (retail, Bujumbura)                                           48      16      Cassava
 Cameroon (retail,                                                                     Congo, Dem. Rep. of (retail,
                                                                       43       4                                       -20        53
 Yaounde)                                                                              Kinshasa)
 Uganda (wholesale,                                                                    Mozambique (retail,
                                                                       38       5                                       -39        32
 Kampala)a                                                                             Nampula)
                                                                                       Cape Verde (retail,
 Kenya (wholesale, Nairobi)a                                           22       4                                       -26        ..
                                                                                       Santiago)

Source: FAO, GIEWS.
a. Prices in U.S. dollars because local currency prices unavailable.


POVERTY REDUCTION & EQUITY GROUP • WWW.WORLDBANK.ORG/POVERTY
POVERTY REDUCTION AND ECONOMIC MANAGEMENT (PREM) NETWORK
THE WORLD BANK GROUP                                                                                                                       3
prices are also passed through to consumers indirectly       These higher prices feed through to domestic prices
by raising animal feed prices, meat prices, and the price    quickly in many countries—for instance, sugar prices
of many processed food categories.                           doubled in Cambodia between June and December
    Global rice prices have increased at a slower rate       2010 and edible oil prices increased by 15% between
than other grains and the outlook remains stable. The        September and December in Afghanistan. Several
export price for Thai rice has increased by 8% (Thai 5%)     countries have intervened to temper this pass through.
between October and January 2011, and 17% since June         In Algeria, taxes and import duties on sugar and edible
2010. They remain about 70% below the peak reached           oil were sharply reduced in January 2011 due to double-
during the 2008 food crisis. Following good harvests in      digit prices rises. In Indonesia, the government has
large exporting countries, the decision by the Philippines   reduced taxes on sugar and increased subsidies to local
to limit imports, and the release of large stocks onto the   cooking oil producers.
market by Thailand, prices appear to be leveling off. One        Prices of other food items essential for dietary
factor limiting the downward pressure on rice prices are     diversity have risen in many countries. In India, food
recent announcements by large importers such as              inflation stood at 18.3% in December partly due to the
Bangladesh and Indonesia to significantly increase           higher prices of fruits and vegetables, milk, meat, and
domestic stocks.                                             fish. In China, similarly, food inflation was driven largely
    Domestic rice prices have risen sharply in some          by vegetables (see figure 3). In the second half of 2010,
countries and remained steady in others. The domestic        beans prices increased dramatically in Burundi (48%),
price of rice was significantly higher in Vietnam (46%)      Cameroon (43%), Kenya (38%), and Uganda (22%). In
                                                             Mongolia, an outbreak of the foot and mouth disease,
and Burundi (41%) between June–December 2010.
                                                             coupled with a severe winter experienced in 2010, led to
Indonesia (19%), Bangladesh (19%), and Pakistan (19%)
                                                             a sharp increase in meat prices. Average mutton meat
have increased in line with global prices. These Asian
                                                             prices were 32% higher in 2010 compared to 2009.
countries are large rice consumers, especially among the
poor. Rice prices have increased in Vietnam despite good         These food price rises create a range of macro
domestic harvests. This is primarily due to the              vulnerabilities. One aspect is the impact on domestic
depreciation of the currency, which has fuelled overall      food inflation and overall inflation. More than one-third
                                                             of the countries in Eastern Europe and Central Asia had
inflation and expectations of higher demand from large
                                                             more than 10% food inflation in 2010. Countries with a
importers and led to the minimum rice export price
                                                             high share of net food and energy imports face current
being raised by the Vietnamese government. Rice price
                                                             account vulnerabilities. These include Tajikistan, the
increases in Sri Lanka (12%) and China (9%) have been
                                                             Kyrgyz Republic, Georgia, and Albania in Eastern
relatively moderate in the second half of 2010, while in     Europe and Central Asia, a region where limiting
Cambodia and the Philippines the retail price of rice        current account deficits is particularly important
remained largely unchanged during this period. Rice          following the 2009 financial crisis. The fiscal impact of
prices outside Asia remained stable in many countries,       these price rises depends on the extent to which food tax
such as Cameroon, Guatemala, Mexico, Panama, and             revenues increase and expenditures on mitigating
Somalia, during this period.                                 measures—such as for social protection programs—are
   Sugar and edible oil prices have increased sharply in     increased.
recent months. Sugar prices have risen by 73% since              Our estimates suggest that an additional 44 million
June due to supply shortfalls from Brazil, the largest       people may have fallen into poverty in low- and middle-
exporter, and weather shocks in Australia. Similarly,        income countries due to the rise in food prices since
edible oil prices were up on account of a number of          June 2010. In order to assess the impact on poverty of
weather-related shocks. Prolonged dry weather related        the change in food prices in the second half of 2010, we
to La Nina lowered expectations of yields in Brazil and      extend a model used to estimate the impact of the 2008
Argentina, which together account for roughly 45% of         food price crisis (see box 1 for the details). Net producers
soybean exports. On the other hand, floods in southern       of food benefit from higher prices while net consumers
Malaysia and Indonesia have hindered palm oil harvests.      suffer. Our results show that extreme poverty in low-


POVERTY REDUCTION & EQUITY GROUP • WWW.WORLDBANK.ORG/POVERTY
POVERTY REDUCTION AND ECONOMIC MANAGEMENT (PREM) NETWORK
THE WORLD BANK GROUP                                                                                                   4
Figure 3. Food Inflation in China (percent of                                                                                through of global staple prices and allowed for
change, year-on-year)                                                                                                        substitution away from imported wheat and rice in
40                                                                                                                           some of the most vulnerable countries. Second, in sharp
                     Food                    Beans                     Vegetables                          Pork              contrast to 2008 and buoyed by good harvests in
35
30
                                                                                                                             Vietnam and Thailand, the fundamentals in the supply
25
                                                                                                                             situation in the rice market remain strong. Rice is an
                                                                                                                             important commodity not only because it is the primary
20
                                                                                                                             staple for many developing countries, but also because it
15
                                                                                                                             was the main source of the contagion that precipitated
10
                                                                                                                             the 2008 crisis when many large exporters banned its
  5
                                                                                                                             export.
  0
 -5
                                                                                                                                 There are several short- and medium-term policy
                                                                                                                             implications of this recent round of food price rises.
-10
                                                                                                                             There are certain key commodity markets, such as rice,
-15
                                                                                                                             where informational uncertainty (for example, of stocks
        Nov-09


                                                                                                                    Nov-10
                                   Feb-10


                                                                                                  Sep-10
                                                              May-10


                                                                                                           Oct-10
                                                                                         Aug-10
                                                                       Jun-10

                                                                                Jul-10
                                                     Apr-10
                                            Mar-10
                 Dec-09

                          Jan-10


                                                                                                                             held by large exporters) and ‘panic buying’ may keep
                                                                                                                             prices from falling to the levels expected by the good
Source: World Bank East Asia and Pacific Region.                                                                             harvests. The publication of regular, accessible data on
                                                                                                                             stocks as well as commitments by larger exporters not to
                                                                                                                             impose export restrictions would help maintain
and middle-income countries may have increased by 44                                                                         stability, which is crucial to prevent further increases in
million people in net terms as a result of the food price                                                                    poverty. At the same time, safety net and nutritional
increases between June and December 2010. This                                                                               programs need to be scaled up in vulnerable countries—
reflects 68 million people who fell below the $1.25
                                                                                                                             and the international community may need to focus on
poverty line and the 24 million net food producers who
                                                                                                                             countries like Afghanistan, Burundi, the Democratic
were able to escape extreme poverty.
                                                                                                                             Republic of Congo, the Kyrgyz Republic, and Mongolia,
    There are nutritional implications related to higher                                                                     to name a few, that are facing large price spikes. Countries
food prices. Higher poverty is associated with increased                                                                     that are large net commodity importers with low reserve
malnutrition as poorer people eat less and substitute                                                                        cover and limited fiscal space will need to be monitored
away from more expensive, nutritious food and into                                                                           to assess their external financing needs. The frequency
cheaper staples. These nutritional setbacks are                                                                              of extreme weather-related events over the past year and
particularly severe for infants between the ages of zero                                                                     their impact on food prices underscores the vulnerability
and two as well as pregnant women. The complex                                                                               of the poor to climate change. Over the medium term,
linkages across food markets also affect obesity—for                                                                         investments in raising environmentally sustainable
instance, the increased demand for high fructose corn                                                                        agricultural productivity, climate change adaptation
syrup, as a substitute for more expensive sugar, has                                                                         measures, and finding less food intensive biofuel
public policy implications in a country like Mexico,                                                                         technologies are all necessary to mitigate the impact of
where obesity is a serious public health concern.                                                                            food price volatility on the most vulnerable. Finally,
    There are two factors limiting the poverty impact of                                                                     these spikes underscore the importance of efforts to
the current global price spike. In many countries in                                                                         raise incomes of the poor so that they spend a lower
Africa, good harvests of domestic crops—like maize,                                                                          share of their budgets on food and are less vulnerable to
sorghum, millet and cassava—have limited the pass                                                                            such shocks.
                                                                                                                                                                               Box 1 next page


POVERTY REDUCTION & EQUITY GROUP • WWW.WORLDBANK.ORG/POVERTY
POVERTY REDUCTION AND ECONOMIC MANAGEMENT (PREM) NETWORK
THE WORLD BANK GROUP                                                                                                                                                                        5
Box 1. Estimating the Poverty Impact of Recent Food Price Rises
 To quantify the poverty impacts of the recent rise in food prices, we use a global computable model
 (Global Trade Analysis Project [GTAP]) with a sample of 28 household surveys with data on individual
 households’ expenditures and income sources. These national surveys are drawn from low- and middle-
 income regions from around the world and represent 41% of the population living in these countries (see
 table 1).We use local food price changes for the commodities where we have data for the June–December
 2010 period. For the commodities where the local price data do not exist, we work out the pass through
 of global commodity price changes on local prices using the share of that commodity’s import in total
 consumption. In the second stage of our calculations, we apply the expected domestic price changes to
 determine the increase in the cost of living for net consumers and the increased profits of net producers.
 Combining these two impacts, we calculate the net impact on each household and determine whether it
 has been thrown into or lifted from poverty, defined at the expenditure level of $1.25 per person per day.
 The results show that in half of our sample, we observe an increase in poverty greater than 0.5 percentage
 points, and in eight countries an increase of more than 1 percentage point, including Tajikistan, where
 poverty is expected to have risen by more than 3.6 percentage points, and Pakistan, where the 1.9
 percentage point increase in poverty is mostly due to higher wheat prices, with the impact on consumers
 far outweighing the beneficial impact on medium and large farmers. In contrast, in Vietnam, poverty is
 expected to have declined because a large portion of poor households are net producers of rice and
 benefit from their high price. Applying the population-weighted average increase in poverty to the total
 population in low- and middle-income countries, we infer that the recent rise in food prices may have put
 44 million people into poverty in these countries. This reflects 68 million people who fell below the $1.25
 poverty line and the 24 million net food producers who were able to escape extreme poverty.


                                                                                                           Share of the
                                                                                                            population                  Poverty rate
                                          Total population             Sample population                   covered by                     change,                      Poverty rate
  Country type                               (millions)                   (millions)                       sample (%)                percentage points               change (millions)
  Low-income countries                             828                            286                            34.5                            1.1                            9.5
  Middle-income countries                        4,758                          1,987                            41.8                            0.7                           34.1
  Total                                          5,586                          2,272                            40.7                            0.8                           44.0
 Source: World Bank staff estimates produced by the Agriculture and Rural Development Unit of the Development Research Group and the Poverty Reduction and Equity Group. Estimates for the
 poverty impact of 2008 food price increases using this model can be found in M. Ivanic and W. Martin (2008), “Implications of Higher Global Food Prices for Poverty in Low-Income Countries,”
 Agricultural Economics 39 (Supplement): 405–16.


POVERTY REDUCTION & EQUITY GROUP • WWW.WORLDBANK.ORG/POVERTY
POVERTY REDUCTION AND ECONOMIC MANAGEMENT (PREM) NETWORK
THE WORLD BANK GROUP                                                                                                                                                                             6

Mais conteúdo relacionado

Mais procurados

the global food crisis
the global food crisisthe global food crisis
the global food crisisBidur Pyare
 
Sharing gains of the potato in Kenya: A case of thin governanceSharing gains ...
Sharing gains of the potato in Kenya: A case of thin governanceSharing gains ...Sharing gains of the potato in Kenya: A case of thin governanceSharing gains ...
Sharing gains of the potato in Kenya: A case of thin governanceSharing gains ...Premier Publishers
 
Transmission of South African maize prices into Botswana markets: an economet...
Transmission of South African maize prices into Botswana markets: an economet...Transmission of South African maize prices into Botswana markets: an economet...
Transmission of South African maize prices into Botswana markets: an economet...Premier Publishers
 
An Investment Analysis on Food Processing Industry
An Investment Analysis on Food Processing IndustryAn Investment Analysis on Food Processing Industry
An Investment Analysis on Food Processing IndustrySatyamGupta169
 
Investing in Agriculture - October Agcapita
Investing in Agriculture - October AgcapitaInvesting in Agriculture - October Agcapita
Investing in Agriculture - October AgcapitaVeripath Partners
 
Estimating NTBs costs of Maize Production and Marketing for Smallholder Farme...
Estimating NTBs costs of Maize Production and Marketing for Smallholder Farme...Estimating NTBs costs of Maize Production and Marketing for Smallholder Farme...
Estimating NTBs costs of Maize Production and Marketing for Smallholder Farme...Premier Publishers
 
Effectiveness Analysis of Agricultural Protection Policy on Food Supply, Expo...
Effectiveness Analysis of Agricultural Protection Policy on Food Supply, Expo...Effectiveness Analysis of Agricultural Protection Policy on Food Supply, Expo...
Effectiveness Analysis of Agricultural Protection Policy on Food Supply, Expo...American Center of Science and Education.
 
Daily livestock report feb 11 2013
Daily livestock report feb 11 2013Daily livestock report feb 11 2013
Daily livestock report feb 11 2013joseleorcasita
 
HSBC - The Future is Farming
HSBC - The Future is FarmingHSBC - The Future is Farming
HSBC - The Future is FarmingVeripath Partners
 
Agricultural export crop participation, contract farming and rural livelihood...
Agricultural export crop participation, contract farming and rural livelihood...Agricultural export crop participation, contract farming and rural livelihood...
Agricultural export crop participation, contract farming and rural livelihood...iosrjce
 
GCARD2: Briefing paper National Food Security - MAIZE and its importance for ...
GCARD2: Briefing paper National Food Security - MAIZE and its importance for ...GCARD2: Briefing paper National Food Security - MAIZE and its importance for ...
GCARD2: Briefing paper National Food Security - MAIZE and its importance for ...GCARD Conferences
 

Mais procurados (20)

the global food crisis
the global food crisisthe global food crisis
the global food crisis
 
2019 The State of Food Security and Nutrition in the World: Safeguarding Agai...
2019 The State of Food Security and Nutrition in the World: Safeguarding Agai...2019 The State of Food Security and Nutrition in the World: Safeguarding Agai...
2019 The State of Food Security and Nutrition in the World: Safeguarding Agai...
 
Sharing gains of the potato in Kenya: A case of thin governanceSharing gains ...
Sharing gains of the potato in Kenya: A case of thin governanceSharing gains ...Sharing gains of the potato in Kenya: A case of thin governanceSharing gains ...
Sharing gains of the potato in Kenya: A case of thin governanceSharing gains ...
 
Egypt Food Security
Egypt Food SecurityEgypt Food Security
Egypt Food Security
 
A Global Value Chain Analysis of Food Security and Food Staples for Major Ene...
A Global Value Chain Analysis of Food Security and Food Staples for Major Ene...A Global Value Chain Analysis of Food Security and Food Staples for Major Ene...
A Global Value Chain Analysis of Food Security and Food Staples for Major Ene...
 
Transmission of South African maize prices into Botswana markets: an economet...
Transmission of South African maize prices into Botswana markets: an economet...Transmission of South African maize prices into Botswana markets: an economet...
Transmission of South African maize prices into Botswana markets: an economet...
 
Global Value Chain Analysis of Food Security and Food Staples for Major Energ...
Global Value Chain Analysis of Food Security and Food Staples for Major Energ...Global Value Chain Analysis of Food Security and Food Staples for Major Energ...
Global Value Chain Analysis of Food Security and Food Staples for Major Energ...
 
An Investment Analysis on Food Processing Industry
An Investment Analysis on Food Processing IndustryAn Investment Analysis on Food Processing Industry
An Investment Analysis on Food Processing Industry
 
Investing in Agriculture - October Agcapita
Investing in Agriculture - October AgcapitaInvesting in Agriculture - October Agcapita
Investing in Agriculture - October Agcapita
 
The Wheat Value Chain and Food Security in the Middle East and North Africa
The Wheat Value Chain and Food Security in the Middle East and North AfricaThe Wheat Value Chain and Food Security in the Middle East and North Africa
The Wheat Value Chain and Food Security in the Middle East and North Africa
 
Synthesis of IFADs Analytical Work on Food Prices, Ganesh Thapa
Synthesis of IFADs Analytical Work on Food Prices, Ganesh ThapaSynthesis of IFADs Analytical Work on Food Prices, Ganesh Thapa
Synthesis of IFADs Analytical Work on Food Prices, Ganesh Thapa
 
Estimating NTBs costs of Maize Production and Marketing for Smallholder Farme...
Estimating NTBs costs of Maize Production and Marketing for Smallholder Farme...Estimating NTBs costs of Maize Production and Marketing for Smallholder Farme...
Estimating NTBs costs of Maize Production and Marketing for Smallholder Farme...
 
Effectiveness Analysis of Agricultural Protection Policy on Food Supply, Expo...
Effectiveness Analysis of Agricultural Protection Policy on Food Supply, Expo...Effectiveness Analysis of Agricultural Protection Policy on Food Supply, Expo...
Effectiveness Analysis of Agricultural Protection Policy on Food Supply, Expo...
 
Agri commodity fao
Agri commodity faoAgri commodity fao
Agri commodity fao
 
Commodities - IGC Conference
Commodities - IGC ConferenceCommodities - IGC Conference
Commodities - IGC Conference
 
Global Feed Markets: May - June 2012
Global Feed Markets: May - June 2012Global Feed Markets: May - June 2012
Global Feed Markets: May - June 2012
 
Daily livestock report feb 11 2013
Daily livestock report feb 11 2013Daily livestock report feb 11 2013
Daily livestock report feb 11 2013
 
HSBC - The Future is Farming
HSBC - The Future is FarmingHSBC - The Future is Farming
HSBC - The Future is Farming
 
Agricultural export crop participation, contract farming and rural livelihood...
Agricultural export crop participation, contract farming and rural livelihood...Agricultural export crop participation, contract farming and rural livelihood...
Agricultural export crop participation, contract farming and rural livelihood...
 
GCARD2: Briefing paper National Food Security - MAIZE and its importance for ...
GCARD2: Briefing paper National Food Security - MAIZE and its importance for ...GCARD2: Briefing paper National Food Security - MAIZE and its importance for ...
GCARD2: Briefing paper National Food Security - MAIZE and its importance for ...
 

Semelhante a Food price watch_feb_2011

Analysis of price volatility and implications for price
Analysis of price volatility and implications for priceAnalysis of price volatility and implications for price
Analysis of price volatility and implications for priceAlexander Decker
 
Food Prices and Inflation in Developing Asia
Food Prices and Inflation in Developing AsiaFood Prices and Inflation in Developing Asia
Food Prices and Inflation in Developing AsiaPoverty Environment Net
 
2008 Chpa Perkins
2008 Chpa Perkins2008 Chpa Perkins
2008 Chpa Perkinsmesaredonda
 
Global Food Security Alarm
Global Food Security AlarmGlobal Food Security Alarm
Global Food Security AlarmANM Farukh
 
Food security: Yesterday Today and Tomorrow
Food security: Yesterday Today and Tomorrow Food security: Yesterday Today and Tomorrow
Food security: Yesterday Today and Tomorrow Abhishek Khadka
 
2010 council newdelhi_ifa_outlook
2010 council newdelhi_ifa_outlook2010 council newdelhi_ifa_outlook
2010 council newdelhi_ifa_outlookJignesh Fichadiya
 
Global Food Security: What Role for Trade Policies?
Global Food Security: What Role for Trade Policies?Global Food Security: What Role for Trade Policies?
Global Food Security: What Role for Trade Policies?Waite Research Institute
 
Ppt on food security issues and challenges beofe india
Ppt on food security issues and challenges beofe indiaPpt on food security issues and challenges beofe india
Ppt on food security issues and challenges beofe indiaDr. Mohmed Amin Mir
 
1. INTRODUCTIONCheap food has been taken for granted for almost .docx
1. INTRODUCTIONCheap food has been taken for granted for almost .docx1. INTRODUCTIONCheap food has been taken for granted for almost .docx
1. INTRODUCTIONCheap food has been taken for granted for almost .docxjackiewalcutt
 
Drought in the us causes sudden spike in food prices
Drought in the us causes sudden spike in food pricesDrought in the us causes sudden spike in food prices
Drought in the us causes sudden spike in food pricesQNB Group
 
Informal stakeholder meeting_kenya_ppt-victor
Informal stakeholder meeting_kenya_ppt-victorInformal stakeholder meeting_kenya_ppt-victor
Informal stakeholder meeting_kenya_ppt-victorJulien Grollier
 
Food Economics And Consumer Choice White Paper
Food Economics And Consumer Choice White PaperFood Economics And Consumer Choice White Paper
Food Economics And Consumer Choice White PaperJohn Blue
 
Pres welfare index
Pres welfare indexPres welfare index
Pres welfare indexlmyles
 

Semelhante a Food price watch_feb_2011 (20)

Analysis of price volatility and implications for price
Analysis of price volatility and implications for priceAnalysis of price volatility and implications for price
Analysis of price volatility and implications for price
 
Food Prices and Inflation in Developing Asia
Food Prices and Inflation in Developing AsiaFood Prices and Inflation in Developing Asia
Food Prices and Inflation in Developing Asia
 
2008 Chpa Perkins
2008 Chpa Perkins2008 Chpa Perkins
2008 Chpa Perkins
 
Biofuel Expansion: Challenges, Risks and Opportunities
Biofuel Expansion: Challenges, Risks and OpportunitiesBiofuel Expansion: Challenges, Risks and Opportunities
Biofuel Expansion: Challenges, Risks and Opportunities
 
1. 1 14
1. 1 141. 1 14
1. 1 14
 
3645754 content
3645754  content3645754  content
3645754 content
 
Global Food Security Alarm
Global Food Security AlarmGlobal Food Security Alarm
Global Food Security Alarm
 
Food security: Yesterday Today and Tomorrow
Food security: Yesterday Today and Tomorrow Food security: Yesterday Today and Tomorrow
Food security: Yesterday Today and Tomorrow
 
2010 council newdelhi_ifa_outlook
2010 council newdelhi_ifa_outlook2010 council newdelhi_ifa_outlook
2010 council newdelhi_ifa_outlook
 
Global Food Security: What Role for Trade Policies?
Global Food Security: What Role for Trade Policies?Global Food Security: What Role for Trade Policies?
Global Food Security: What Role for Trade Policies?
 
Febnews11
Febnews11Febnews11
Febnews11
 
Ppt on food security issues and challenges beofe india
Ppt on food security issues and challenges beofe indiaPpt on food security issues and challenges beofe india
Ppt on food security issues and challenges beofe india
 
1. INTRODUCTIONCheap food has been taken for granted for almost .docx
1. INTRODUCTIONCheap food has been taken for granted for almost .docx1. INTRODUCTIONCheap food has been taken for granted for almost .docx
1. INTRODUCTIONCheap food has been taken for granted for almost .docx
 
Drought in the us causes sudden spike in food prices
Drought in the us causes sudden spike in food pricesDrought in the us causes sudden spike in food prices
Drought in the us causes sudden spike in food prices
 
Kenya nd2010 ppt-otieno
Kenya nd2010 ppt-otienoKenya nd2010 ppt-otieno
Kenya nd2010 ppt-otieno
 
MTBiz August 2012
MTBiz August 2012 MTBiz August 2012
MTBiz August 2012
 
Informal stakeholder meeting_kenya_ppt-victor
Informal stakeholder meeting_kenya_ppt-victorInformal stakeholder meeting_kenya_ppt-victor
Informal stakeholder meeting_kenya_ppt-victor
 
Food Economics And Consumer Choice White Paper
Food Economics And Consumer Choice White PaperFood Economics And Consumer Choice White Paper
Food Economics And Consumer Choice White Paper
 
English summary
English summaryEnglish summary
English summary
 
Pres welfare index
Pres welfare indexPres welfare index
Pres welfare index
 

Mais de bueno buono good

Informe del Relator Especial sobre los derechos de los pueblos indígenas, Ja...
Informe del Relator Especial sobre los derechos de los  pueblos indígenas, Ja...Informe del Relator Especial sobre los derechos de los  pueblos indígenas, Ja...
Informe del Relator Especial sobre los derechos de los pueblos indígenas, Ja...bueno buono good
 
Complete patents nikola_tesla
Complete patents nikola_teslaComplete patents nikola_tesla
Complete patents nikola_teslabueno buono good
 
Global energy transmittion tesla tower 2014
Global energy transmittion tesla tower 2014Global energy transmittion tesla tower 2014
Global energy transmittion tesla tower 2014bueno buono good
 
Wikileaks secret-tpp-treaty-ip-chapter
Wikileaks secret-tpp-treaty-ip-chapterWikileaks secret-tpp-treaty-ip-chapter
Wikileaks secret-tpp-treaty-ip-chapterbueno buono good
 
Farmaci coinvolti traffici_illegali_14.08.2014
Farmaci coinvolti traffici_illegali_14.08.2014Farmaci coinvolti traffici_illegali_14.08.2014
Farmaci coinvolti traffici_illegali_14.08.2014bueno buono good
 
Country reports on_terrorism_2013-7
Country reports on_terrorism_2013-7Country reports on_terrorism_2013-7
Country reports on_terrorism_2013-7bueno buono good
 
Bohemian grove-members-list 2010
Bohemian grove-members-list 2010Bohemian grove-members-list 2010
Bohemian grove-members-list 2010bueno buono good
 
Bohemian grove-and-other-retreats1
Bohemian grove-and-other-retreats1Bohemian grove-and-other-retreats1
Bohemian grove-and-other-retreats1bueno buono good
 
Cremation of care traduzione italiano
Cremation of care traduzione italianoCremation of care traduzione italiano
Cremation of care traduzione italianobueno buono good
 

Mais de bueno buono good (20)

Privacy facebook 2015
Privacy facebook 2015Privacy facebook 2015
Privacy facebook 2015
 
LIBERTÀ STAMPA 2014
LIBERTÀ STAMPA 2014LIBERTÀ STAMPA 2014
LIBERTÀ STAMPA 2014
 
Inceneration and health
Inceneration and healthInceneration and health
Inceneration and health
 
Informe del Relator Especial sobre los derechos de los pueblos indígenas, Ja...
Informe del Relator Especial sobre los derechos de los  pueblos indígenas, Ja...Informe del Relator Especial sobre los derechos de los  pueblos indígenas, Ja...
Informe del Relator Especial sobre los derechos de los pueblos indígenas, Ja...
 
Galline libere guida
Galline libere guidaGalline libere guida
Galline libere guida
 
Water resourcers group
Water resourcers groupWater resourcers group
Water resourcers group
 
NkpPS
NkpPSNkpPS
NkpPS
 
Tesla confid
Tesla confidTesla confid
Tesla confid
 
Complete patents nikola_tesla
Complete patents nikola_teslaComplete patents nikola_tesla
Complete patents nikola_tesla
 
Global energy transmittion tesla tower 2014
Global energy transmittion tesla tower 2014Global energy transmittion tesla tower 2014
Global energy transmittion tesla tower 2014
 
Wikileaks secret-tpp-treaty-ip-chapter
Wikileaks secret-tpp-treaty-ip-chapterWikileaks secret-tpp-treaty-ip-chapter
Wikileaks secret-tpp-treaty-ip-chapter
 
Ttip draft
Ttip draftTtip draft
Ttip draft
 
2013 cpi brochure_en
2013 cpi brochure_en2013 cpi brochure_en
2013 cpi brochure_en
 
Farmaci coinvolti traffici_illegali_14.08.2014
Farmaci coinvolti traffici_illegali_14.08.2014Farmaci coinvolti traffici_illegali_14.08.2014
Farmaci coinvolti traffici_illegali_14.08.2014
 
Country reports on_terrorism_2013-7
Country reports on_terrorism_2013-7Country reports on_terrorism_2013-7
Country reports on_terrorism_2013-7
 
Doc 10502 290_en
Doc 10502 290_enDoc 10502 290_en
Doc 10502 290_en
 
Sipri yearbook 2013
Sipri yearbook 2013Sipri yearbook 2013
Sipri yearbook 2013
 
Bohemian grove-members-list 2010
Bohemian grove-members-list 2010Bohemian grove-members-list 2010
Bohemian grove-members-list 2010
 
Bohemian grove-and-other-retreats1
Bohemian grove-and-other-retreats1Bohemian grove-and-other-retreats1
Bohemian grove-and-other-retreats1
 
Cremation of care traduzione italiano
Cremation of care traduzione italianoCremation of care traduzione italiano
Cremation of care traduzione italiano
 

Food price watch_feb_2011

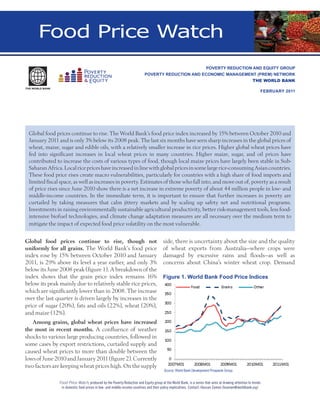
  • 1. Food Price Watch POVERTY REDUCTION AND EQUITY GROUP POVERTY REDUCTION AND ECONOMIC MANAGEMENT (PREM) NETWORK THE WORLD BANK FEBRUARY 2011 Global food prices continue to rise. The World Bank’s food price index increased by 15% between October 2010 and January 2011 and is only 3% below its 2008 peak. The last six months have seen sharp increases in the global prices of wheat, maize, sugar and edible oils, with a relatively smaller increase in rice prices. Higher global wheat prices have fed into significant increases in local wheat prices in many countries. Higher maize, sugar, and oil prices have contributed to increase the costs of various types of food, though local maize prices have largely been stable in Sub- Saharan Africa. Local rice prices have increased in line with global prices in some large rice-consuming Asian countries. These food price rises create macro vulnerabilities, particularly for countries with a high share of food imports and limited fiscal space, as well as increases in poverty. Estimates of those who fall into, and move out of, poverty as a result of price rises since June 2010 show there is a net increase in extreme poverty of about 44 million people in low- and middle-income countries. In the immediate term, it is important to ensure that further increases in poverty are curtailed by taking measures that calm jittery markets and by scaling up safety net and nutritional programs. Investments in raising environmentally sustainable agricultural productivity, better risk-management tools, less food- intensive biofuel technologies, and climate change adaptation measures are all necessary over the medium term to mitigate the impact of expected food price volatility on the most vulnerable. Global food prices continue to rise, though not side, there is uncertainty about the size and the quality uniformly for all grains. The World Bank’s food price of wheat exports from Australia—where crops were index rose by 15% between October 2010 and January damaged by excessive rains and floods—as well as 2011, is 29% above its level a year earlier, and only 3% concerns about China’s winter wheat crop. Demand below its June 2008 peak (figure 1). A breakdown of the index shows that the grain price index remains 16% Figure 1. World Bank Food Price Indices below its peak mainly due to relatively stable rice prices, which are significantly lower than in 2008. The increase over the last quarter is driven largely by increases in the price of sugar (20%), fats and oils (22%), wheat (20%), and maize (12%). Among grains, global wheat prices have increased the most in recent months. A confluence of weather shocks to various large producing countries, followed in some cases by export restrictions, curtailed supply and caused wheat prices to more than double between the lows of June 2010 and January 2011 (figure 2). Currently two factors are keeping wheat prices high. On the supply Source: World Bank Development Prospects Group. Food Price Watch, produced by the Poverty Reduction and Equity group at the World Bank, is a series that aims at drawing attention to trends in domestic food prices in low- and middle-income countries and their policy implications. Contact: Hassan Zaman (hzaman@worldbank.org)
  • 2. Figure 2. Global Prices of Key Food the impact of global price rises as prices of nonsubsidized Commodities wheat products, as well as other basic staples, have increased. Local practices have also shielded consumers from higher global wheat prices—for instance in Cambodia bread prices have remained stable as consumers use flour made from locally produced cassava. Maize prices have increased sharply and are affected by complex linkages with other markets. In January 2011, maize prices were about 73% higher than June 2010. These increases are due to a series of downward revisions of crop forecasts, low stocks (U.S. stocks-to-use ratio for 2010/11 is projected to be 5%, the lowest since 1995), the positive relationship between maize and wheat prices, and the use of corn for biofuels. Ethanol production demand for corn increases as oil prices go up, with sugar-based ethanol less competitive at current Source: World Bank Development Prospects Group. sugar prices. Recent United States Department of Agriculture (USDA) estimates show the share of ethanol drivers center around the possibility of large wheat- for fuel rising from 31% of U.S. corn output in 2008/9 importing countries, particularly in the Middle East and to a projected 40% in 2010/11. Increased demand for North Africa, coming to the market with large orders. high fructose corn syrup from countries such as Mexico, These are related to assuring the public that adequate as they substitute away from higher priced sugar, also domestic food stocks exist during uncertain political contributes to higher demand for corn. Prospects of times in some countries. Another reason is that countries easing in this market depend partly on the size of the like Saudi Arabia are progressively reducing domestic crops in Latin America, particularly Argentina, which production of wheat to conserve valuable water has been affected by unusually dry weather due to the resources and relying more on imports. La Nina effect, and the extent of import demand from Higher global wheat prices have fed into sharp China in 2011 as well as oil and sugar price trajectories. increases in domestic wheat prices in many countries. The transmission of higher global maize prices is The transmission rate of global wheat price increases to varied and has depended significantly on domestic the domestic price of wheat-related products has been harvest conditions. Countries in Sub-Saharan Africa high in many countries. For instance, between June have benefitted from excellent maize harvests, which 2010 and December 2010, the price of wheat increased have led to a sharp fall in prices. The declines from by large amounts in Kyrgyzstan (54%), Bangladesh June–December 2010 shown in table 1 come on the (45%), Tajikistan (37%), Mongolia (33%), Sri Lanka heels of even sharper price falls in the early part of the (31%), Azerbaijan (24%), Afghanistan (19%), Sudan year—on average, maize prices were lower in 2010 in (16%), and Pakistan (16%). Several of these countries comparison to 2009 in Uganda (52%), Rwanda (37%), have a large share of calories consumed from wheat- Kenya (33%), Malawi (30%), Ethiopia (22%), and based products, particularly for the poor (table 1). Tanzania (19%).1 However, these prices also exhibit In several other countries, the adjustment to higher considerable volatility, which has adverse impacts on global wheat prices has been shared by the government both producers and consumers. For instance, after a and consumers. In India, higher domestic procurement sharp decline in the early part of 2010, maize prices in prices for wheat have contributed to record domestic Rwanda have rebounded by 19% since June 2010. grain stocks, which have been released to curb prices. In Several Latin American countries saw the price of maize parallel, the subsidized wheat program has been scaled rise dramatically in the last half of 2010 as dry weather up. In Egypt, the bread subsidy is estimated to reach lowered yields—the largest increases were witnessed in around 85% of the population. Nevertheless, even in Brazil (56%) and Argentina (40%). Higher global maize these countries, consumers are not fully exempted from 1 The prices for Uganda, Rwanda, Kenya and Tanzania are in U.S. dollars. POVERTY REDUCTION & EQUITY GROUP • WWW.WORLDBANK.ORG/POVERTY POVERTY REDUCTION AND ECONOMIC MANAGEMENT (PREM) NETWORK THE WORLD BANK GROUP 2
  • 3. Table 1. Largest Movers in Domestic Prices, June to December 2010 Change Calorie Change Calorie in price share in price share Product by country (%) (%) Product by country (%) (%) Wheat Rice World price (US$, HRW U.S. World price (US$, 5% Thai, 75 17 Gulf Ports) Bangkok) Kyrgyzstan (retail, Bishkek) 54 40 Vietnam (retail, Dong Thap) 46 59 Bangladesh (retail, national 45 6 Burundi (retail, Bujumbura) 41 3 average) Tajikistan (retail, national 37 54 Bangladesh (retail, Dhaka) 19 70 average) Mongolia (retail, 33 42 Pakistan (retail, Lahore) 19 6 Ulaanbaatar) Indonesia (retail, national Sri Lanka (retail, Colombo) 31 14 19 50 average) Azerbaijan (retail, national 24 57 Mozambique (retail, Maputo) 14 8 average) Cambodia (wholesale, Afghanistan (retail, Kabul) 19 .. -11 65 Phnom Penh) Sudan (wholesale, Mexico (wholesale, Mexico 16 15 -9 2 Khartoum) City) Pakistan (retail, Lahore) 16 37 Maize Brazil (wholesale, São World price (US$, U.S. Gulf 14 13 73 Paulo) Ports) Bolivia (wholesale, La Paz) 10 18 Brazil (wholesale São Paulo) 56 7 Argentina (wholesale, Cameroon (retail, Yaounde) -15 6 40 3 Rosario) Sorghum Rwanda (wholesale, Kigali)a 19 5 Peru (wholesale, national World price 88 12 11 average) Guatemala (retail, national Somalia (retail, Mogadishu) 26 .. 8 40 average) Sudan (wholesale, -37 26 Kenya (wholesale, Nairobi)a -8 35 Khartoum) Ethiopia (wholesale, Addis Mali (wholesale, Bamako) -13 13 -8 21 Ababa) Beans Moldova (retail, Chisinau) -8 22 Burundi (retail, Bujumbura) 48 16 Cassava Cameroon (retail, Congo, Dem. Rep. of (retail, 43 4 -20 53 Yaounde) Kinshasa) Uganda (wholesale, Mozambique (retail, 38 5 -39 32 Kampala)a Nampula) Cape Verde (retail, Kenya (wholesale, Nairobi)a 22 4 -26 .. Santiago) Source: FAO, GIEWS. a. Prices in U.S. dollars because local currency prices unavailable. POVERTY REDUCTION & EQUITY GROUP • WWW.WORLDBANK.ORG/POVERTY POVERTY REDUCTION AND ECONOMIC MANAGEMENT (PREM) NETWORK THE WORLD BANK GROUP 3
  • 4. prices are also passed through to consumers indirectly These higher prices feed through to domestic prices by raising animal feed prices, meat prices, and the price quickly in many countries—for instance, sugar prices of many processed food categories. doubled in Cambodia between June and December Global rice prices have increased at a slower rate 2010 and edible oil prices increased by 15% between than other grains and the outlook remains stable. The September and December in Afghanistan. Several export price for Thai rice has increased by 8% (Thai 5%) countries have intervened to temper this pass through. between October and January 2011, and 17% since June In Algeria, taxes and import duties on sugar and edible 2010. They remain about 70% below the peak reached oil were sharply reduced in January 2011 due to double- during the 2008 food crisis. Following good harvests in digit prices rises. In Indonesia, the government has large exporting countries, the decision by the Philippines reduced taxes on sugar and increased subsidies to local to limit imports, and the release of large stocks onto the cooking oil producers. market by Thailand, prices appear to be leveling off. One Prices of other food items essential for dietary factor limiting the downward pressure on rice prices are diversity have risen in many countries. In India, food recent announcements by large importers such as inflation stood at 18.3% in December partly due to the Bangladesh and Indonesia to significantly increase higher prices of fruits and vegetables, milk, meat, and domestic stocks. fish. In China, similarly, food inflation was driven largely Domestic rice prices have risen sharply in some by vegetables (see figure 3). In the second half of 2010, countries and remained steady in others. The domestic beans prices increased dramatically in Burundi (48%), price of rice was significantly higher in Vietnam (46%) Cameroon (43%), Kenya (38%), and Uganda (22%). In Mongolia, an outbreak of the foot and mouth disease, and Burundi (41%) between June–December 2010. coupled with a severe winter experienced in 2010, led to Indonesia (19%), Bangladesh (19%), and Pakistan (19%) a sharp increase in meat prices. Average mutton meat have increased in line with global prices. These Asian prices were 32% higher in 2010 compared to 2009. countries are large rice consumers, especially among the poor. Rice prices have increased in Vietnam despite good These food price rises create a range of macro domestic harvests. This is primarily due to the vulnerabilities. One aspect is the impact on domestic depreciation of the currency, which has fuelled overall food inflation and overall inflation. More than one-third of the countries in Eastern Europe and Central Asia had inflation and expectations of higher demand from large more than 10% food inflation in 2010. Countries with a importers and led to the minimum rice export price high share of net food and energy imports face current being raised by the Vietnamese government. Rice price account vulnerabilities. These include Tajikistan, the increases in Sri Lanka (12%) and China (9%) have been Kyrgyz Republic, Georgia, and Albania in Eastern relatively moderate in the second half of 2010, while in Europe and Central Asia, a region where limiting Cambodia and the Philippines the retail price of rice current account deficits is particularly important remained largely unchanged during this period. Rice following the 2009 financial crisis. The fiscal impact of prices outside Asia remained stable in many countries, these price rises depends on the extent to which food tax such as Cameroon, Guatemala, Mexico, Panama, and revenues increase and expenditures on mitigating Somalia, during this period. measures—such as for social protection programs—are Sugar and edible oil prices have increased sharply in increased. recent months. Sugar prices have risen by 73% since Our estimates suggest that an additional 44 million June due to supply shortfalls from Brazil, the largest people may have fallen into poverty in low- and middle- exporter, and weather shocks in Australia. Similarly, income countries due to the rise in food prices since edible oil prices were up on account of a number of June 2010. In order to assess the impact on poverty of weather-related shocks. Prolonged dry weather related the change in food prices in the second half of 2010, we to La Nina lowered expectations of yields in Brazil and extend a model used to estimate the impact of the 2008 Argentina, which together account for roughly 45% of food price crisis (see box 1 for the details). Net producers soybean exports. On the other hand, floods in southern of food benefit from higher prices while net consumers Malaysia and Indonesia have hindered palm oil harvests. suffer. Our results show that extreme poverty in low- POVERTY REDUCTION & EQUITY GROUP • WWW.WORLDBANK.ORG/POVERTY POVERTY REDUCTION AND ECONOMIC MANAGEMENT (PREM) NETWORK THE WORLD BANK GROUP 4
  • 5. Figure 3. Food Inflation in China (percent of through of global staple prices and allowed for change, year-on-year) substitution away from imported wheat and rice in 40 some of the most vulnerable countries. Second, in sharp Food Beans Vegetables Pork contrast to 2008 and buoyed by good harvests in 35 30 Vietnam and Thailand, the fundamentals in the supply 25 situation in the rice market remain strong. Rice is an important commodity not only because it is the primary 20 staple for many developing countries, but also because it 15 was the main source of the contagion that precipitated 10 the 2008 crisis when many large exporters banned its 5 export. 0 -5 There are several short- and medium-term policy implications of this recent round of food price rises. -10 There are certain key commodity markets, such as rice, -15 where informational uncertainty (for example, of stocks Nov-09 Nov-10 Feb-10 Sep-10 May-10 Oct-10 Aug-10 Jun-10 Jul-10 Apr-10 Mar-10 Dec-09 Jan-10 held by large exporters) and ‘panic buying’ may keep prices from falling to the levels expected by the good Source: World Bank East Asia and Pacific Region. harvests. The publication of regular, accessible data on stocks as well as commitments by larger exporters not to impose export restrictions would help maintain and middle-income countries may have increased by 44 stability, which is crucial to prevent further increases in million people in net terms as a result of the food price poverty. At the same time, safety net and nutritional increases between June and December 2010. This programs need to be scaled up in vulnerable countries— reflects 68 million people who fell below the $1.25 and the international community may need to focus on poverty line and the 24 million net food producers who countries like Afghanistan, Burundi, the Democratic were able to escape extreme poverty. Republic of Congo, the Kyrgyz Republic, and Mongolia, There are nutritional implications related to higher to name a few, that are facing large price spikes. Countries food prices. Higher poverty is associated with increased that are large net commodity importers with low reserve malnutrition as poorer people eat less and substitute cover and limited fiscal space will need to be monitored away from more expensive, nutritious food and into to assess their external financing needs. The frequency cheaper staples. These nutritional setbacks are of extreme weather-related events over the past year and particularly severe for infants between the ages of zero their impact on food prices underscores the vulnerability and two as well as pregnant women. The complex of the poor to climate change. Over the medium term, linkages across food markets also affect obesity—for investments in raising environmentally sustainable instance, the increased demand for high fructose corn agricultural productivity, climate change adaptation syrup, as a substitute for more expensive sugar, has measures, and finding less food intensive biofuel public policy implications in a country like Mexico, technologies are all necessary to mitigate the impact of where obesity is a serious public health concern. food price volatility on the most vulnerable. Finally, There are two factors limiting the poverty impact of these spikes underscore the importance of efforts to the current global price spike. In many countries in raise incomes of the poor so that they spend a lower Africa, good harvests of domestic crops—like maize, share of their budgets on food and are less vulnerable to sorghum, millet and cassava—have limited the pass such shocks. Box 1 next page POVERTY REDUCTION & EQUITY GROUP • WWW.WORLDBANK.ORG/POVERTY POVERTY REDUCTION AND ECONOMIC MANAGEMENT (PREM) NETWORK THE WORLD BANK GROUP 5
  • 6. Box 1. Estimating the Poverty Impact of Recent Food Price Rises To quantify the poverty impacts of the recent rise in food prices, we use a global computable model (Global Trade Analysis Project [GTAP]) with a sample of 28 household surveys with data on individual households’ expenditures and income sources. These national surveys are drawn from low- and middle- income regions from around the world and represent 41% of the population living in these countries (see table 1).We use local food price changes for the commodities where we have data for the June–December 2010 period. For the commodities where the local price data do not exist, we work out the pass through of global commodity price changes on local prices using the share of that commodity’s import in total consumption. In the second stage of our calculations, we apply the expected domestic price changes to determine the increase in the cost of living for net consumers and the increased profits of net producers. Combining these two impacts, we calculate the net impact on each household and determine whether it has been thrown into or lifted from poverty, defined at the expenditure level of $1.25 per person per day. The results show that in half of our sample, we observe an increase in poverty greater than 0.5 percentage points, and in eight countries an increase of more than 1 percentage point, including Tajikistan, where poverty is expected to have risen by more than 3.6 percentage points, and Pakistan, where the 1.9 percentage point increase in poverty is mostly due to higher wheat prices, with the impact on consumers far outweighing the beneficial impact on medium and large farmers. In contrast, in Vietnam, poverty is expected to have declined because a large portion of poor households are net producers of rice and benefit from their high price. Applying the population-weighted average increase in poverty to the total population in low- and middle-income countries, we infer that the recent rise in food prices may have put 44 million people into poverty in these countries. This reflects 68 million people who fell below the $1.25 poverty line and the 24 million net food producers who were able to escape extreme poverty. Share of the population Poverty rate Total population Sample population covered by change, Poverty rate Country type (millions) (millions) sample (%) percentage points change (millions) Low-income countries 828 286 34.5 1.1 9.5 Middle-income countries 4,758 1,987 41.8 0.7 34.1 Total 5,586 2,272 40.7 0.8 44.0 Source: World Bank staff estimates produced by the Agriculture and Rural Development Unit of the Development Research Group and the Poverty Reduction and Equity Group. Estimates for the poverty impact of 2008 food price increases using this model can be found in M. Ivanic and W. Martin (2008), “Implications of Higher Global Food Prices for Poverty in Low-Income Countries,” Agricultural Economics 39 (Supplement): 405–16. POVERTY REDUCTION & EQUITY GROUP • WWW.WORLDBANK.ORG/POVERTY POVERTY REDUCTION AND ECONOMIC MANAGEMENT (PREM) NETWORK THE WORLD BANK GROUP 6