Value analysis aircrafts evaluation
•
1 gostou•535 visualizações

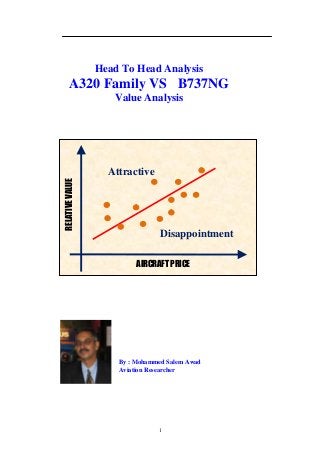
Value analysis is a powerful tool used by aircraft manufactures to compare their aircrafts with other aircraft competitors, it address the technical specification that relate to performance the aircraft with respect with price or value, by creating a base line that split he area of analysis to Attractive and Disappointment.

Recomendados
Recomendados
Mais conteúdo relacionado
Destaque
Mais de Mohammed Hadi
Mais de Mohammed Hadi (17)
Último
Último (20)
Value analysis aircrafts evaluation
- 1. Head To Head Analysis A320 Family VS B737NG Value Analysis Attractive RELATIVE VALUE Disappointment AIRCRAFT PRICE By : Mohammed Salem Awad Aviation Researcher 1
- 2. Head To Head Analysis A320 Family VS B737NG Value Analysis By : Mohammed Salem Awad Aviation Researcher Introduction: Generally most of airlines companies in third world countries found too hard to evaluate commercial aircraft's, due to the complexity of aviation industry and its optimizations programs especially linear program which implemented in the network of the airline also the high techniques that possess by aircraft manufacture and modern sales approach that deliver by their sale forces and their pretend of manufacturing the best commercial aircraft's – products in the world either Airbus Industries or Boeing Group, as both aircraft's of these parties have an excellent characteristics that cannot be differentiated and consequently most of small airlines refer to third party to evaluate their fleets, which normally a consultant company specialize in aviation as Sabre Solutions that implemented statistical tools and analysis in their approaches of evaluation as Value Analysis, Cost per Trip vs Cost per Seat Matrix, and Profit vs Market Opportunity Matrix. While the issue of selecting the right aircraft is a main effective parameter for successful airline, as each market has its own characteristics that reflects/ impact by positive or negative signals on airline network study for the aircraft specification that have different business model as corporate airline, private and taxi air, legacy airline, low cost airlines, and other Mega air carriers and accordingly the aircraft's are diversified and differentiated to be short range and long range, some has small capacity while the others have larger ATTRACTIVE RELATIVE VALUES one. Finally the new technology play a major role to reduce the manufacturing cost for aircraft which reflected by studying the DISAPPOINTMENT technical specifications of the aircraft and their relations with their price and values in market which is addressing by a so-called AIRCRAFT PRICE Value analysis for A320 and B737-NG families. Figure No. ( 1 ) Aircraft Performance Factors Each aircraft characterize by its own performance factors especially the technical one that we can develop the evaluation studies as : 1- Aircraft Configuration 2- Aircraft Speed 3- Mean Takeoff Weight 4- Maximum Payload Range( Kilometers). 5- Maximum Payload Range( Kilograms). 2
- 3. Table No. 1 1 جدول رقم Commercial Aircraft of the World Buyers'guide Dimensions Landing gear Accommodation Weights Fule FAR field lengthsat Speeds Cruise Payload-range Aircraft Span(m) Track Max seating : Ramp Standard gross weight (m) kt/Mach Performance Max payload- Type Langth(m) Wheelbase No./pitchcm/ Take -off Optional ISA,+20Cs.1. V2 Speed(kt) load-range Height(m) Turn radius abreast Landing (lit) ISA,5,000ft VAT Altitude(ft) Max fule Wingarea(m2) (m) Hold vol m/3 Zero-fuel ISA,at20C.5000ft VNO/M MO Fule consumption(kg/h) kg /sweep(.) compartments Ops empty _________________ VNE/MNE ___________________ km (1/4chord) Press diff bars (kg) Take-off Landing Max cruise Longrange A300-600R 44.84 9.6 375/71/9 171.400 68.150 2.290 1.550 153 480 456 40.330 54.08 18.6 116/3 170.500 73.000 2.700 1.550 136 31.000 35.000 6.190 16.53 34 .56 140.000 4.700 1.750 335/0.82 5.120 4.300 26.300 260/28 130.000 nla 1.750 395/0.88 8.800 89.600 A310-300 43.90 9.6 280/76/9 150.900 61.070 2.290 1.480 156 484 458 32.950 46.66 15.2 79.9/3 150.000 68.270 2.44 1.680 138 35.000 37.000 6.900 15.81 31.4 .56 123.000 2.960 1.680 360/0.84 4.690 3730 21.100 219/28 113.000 3.650 1.680 420/0.90 9.600 80.000 757-200 38.05 7.32 239/74/6 109.300 42.320 1.880 1.415 154 502 459 26.350 47.32 18.29 50.7/2 108.800 2.110 1.415 132 31.000 39.000 6.150 13.56 36.6 .58 89.800 2.650 1.595 350/0.86 4.800 2.805 17.440 181/25 83.400 3.350 1.595 n/a 8.760 57.067 767-200 47.60 9.30 220/84/8 143.800 63.215 1770 1465 142 491 458 32.025 48.50 19.70 111.4/3 175.543 1.920 1465 136 39.000 39.000 5.910 15.90 39.3 .58 129.276 2.255 1660 360/0.86 5.350 3.780 10.570 283/31.5 117.936 2.470 1660 n.a 11.335 83.462 As it shown in table one, the relation between the aircraft price and other technical characteristics ( Relative Values – multiplication of these characteristics after filtration ) are addressed in this study. Value Analysis: AIRCRAFT AIRCRAFT One of the most effective methods to select PRICE FACTOR and evaluate the aircraft's is Value Analysis, where it power is to link the technical characteristics of the aircraft with it price and consequently develop Basic Line Reference ( line fit – using regression Coefficient Of Correlation analysis ) that split the area into two parts i.e ( Attractive Region and Disappointment Region) No As indicated in figure ( 1 ). Yes As the Aircraft Characteristics by speed, R > 80 % Rejected capacity , MTOW, Capability range in terms or distance and weight should have a direct relations with its price. But not with fuel consumption as it will reflects a Accepted negative impact on the analysis, as the differentiation should be with a less fuel consumption and not with the high one. And that relation usually address by Flow Chart (1) Coefficient of Correlation for Aircraft ) Characteristics and its price according to the following sequence: Coefficient Of Correlation: The importance of this coefficient is in defining the effective factors that have impact on the value analysis. Simply it is a mathematical formula that explicit the relation between two set of data in terms of percentage ( % ) as this will define how far are 3
- 4. related. While 80 % and above the ideal level to accept that data to included in the analysis. In the context of the statistical analysis normally we use R - coefficient of determination ( squaring of R ) to raise the fairness of the analysis and avoid negative values. Figure No. 2 The Analysis: By implementing all the previous steps and study most of the characteristics of World Fleet of Boeing Groups and Airbus Industries as it it shown in figure ( 2 ), the figures shows Three Groups but unfortunately the coefficient of determination is to poor to accept as it is i.e 12.5%, since we includes all the world fleet and not targeted a certain family, and if we refer again to the the three groups, we will note that the last group contains A320 and B737 families. So by re-analysis the last group data ( targeting the last group ), we will find a relation between Aircraft relative factors and Aircraft price that may reach to 95% and accordingly we can apply minimum least square analysis to find the best line fit to create a Reference Line as it is indicate by figure no. ( 3 ), Witch split the area into two parts of these aircraft's Airbus and Boeing. Consequently we can define which the best aircraft and according to the figure no. (3) we will find that A320 own more favorite relative value than B737-800 and with less purchasing value than B737-800 while if we compare Figure No. ( 3 ) A320 with B737-700 we will find that the 4
- 5. price of B737-700 is less than A320 but don’t reach to technical relative values of A320, so by referring to the prices of both aircraft's, we will find the B737-700 does not reflect a good position of A320 due the difference in prices which may support to re-position the aircraft for a good level. Summary: Value Analysis define clearly the effective and favorite technical factors of aircraft's and its relation to its prices by splitting the area of the graph for two main regions according to the aircraft sampling used and its related category so the first region – Attractive – which characterize by a lower price and high effective factors while the second region – Disappointment – which characters by a high price and less effective factors. That obviously clear by the comparison between A320 and B737-800. Also the analysis can be improve by giving more certain different weights as aircraft capacity, speed of aircraft, and MTOW. All these weight factors will impacts the final results to enhance the decision to purchase the right aircraft. 5