Validating automated structure confirmation in a blind study

PRESENTED AT ENC MEETING IN 2007 The current study focuses not only on the performance of the verification algorithms but also on the automated preparation of experimental data through a blind test. This study was designed to prove that such a system would hold up in an industrial environment without any human intervention. This study consisted of two distinct sets of structures and spectra. The first contained 19 spectra sets (each dataset contained 1D 1H and 2D HSQC spectra) that were provided ahead of time for adjustment of processing settings and options. This step was necessary to identify the best software settings based on the instrument and data collection practices for the laboratory where the samples were prepared and run. Once the first set was run through the system and results of the verification procedure obtained, the second, blind test, was performed on 10 distinct datasets (with chemical structures) that were not available to the software or the software operators in advance. The details and results of these two tests are presented here, along with a comprehensive look at the structures that could not be confirmed.

Recomendados
Mais conteúdo relacionado
Destaque
Último
Último (20)
Validating automated structure confirmation in a blind study
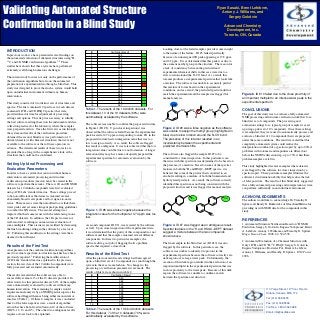
- 1. Validating Automated Structure Ryan Sasaki, Brent Lefebvre, Antony J. Williams, and Sergey Golotvin Confirmation in a Blind Study Advanced Chemistry Development, Inc. Toronto, ON, Canada INTRODUCTION Looking closer at the failed samples provides some insight ID Verification Result to the nature of the failure. ID #3 failed specifically In previous work, we have presented several findings on 1 0.95 2 0.81 because of an unassigned 2D peak appearing at 17.8 ppm the automated evaluation of chemical structures using 1H, 13C, and 2D NMR verification algorithms.1–2 These 3 0.98 and 2.2 ppm. It was determined that this peak was due to 4 0.75 the aromatic methyl group in the structure. The reason for studies have shown that these systems have performed 5 0.79 6 0.00 a lack of consistency between the predicted and extremely well through numerous challenges. 7 0.76 experimental chemical shifts in this case were due to a 8 0.36 slow rotation around the N-CO bond. As a result, this The current study focuses not only on the performance of 9 0.66 10 0.75 rotamer produces an experimental spectrum that looks like the verification algorithms but also on the automated 11 0.00 a mixture. The software was unable to accurately predict preparation of experimental data through a blind test. This 12 0.29 this mixture of forms based on the experimental study was designed to prove that such a system would hold 13 0.40 14 0.92 conditions, and as a result, the predicted spectrum did not up in an industrial environment without any human 15 0.29 match the experimental and the sample was flagged for Figure 6. ID #10 failed due to the close proximity of intervention. 16 0.95 17 0.50 manual analysis. an important multiplet to an intense water peak in the 18 0.88 experimental spectrum. This study consisted of two distinct sets of structures and CH3 19 0.57 O spectra. The first contained 19 spectra sets (each dataset contained 1D 1H and 2D HSQC spectra) that were Table 1. The results of the 19 Aldrich datasets. For NH NH NH N CONCLUSIONS this dataset, 13 of the 19 datasets (69%) were N The goal of this study was to evaluate a fully automated provided ahead of time for adjustment of processing settings and options. This step was necessary to identify automatically evaluated by the software. O H O NMR processing and structure verification workflow for a the best software settings based on the instrument and data Cl blind test set of compounds. The processing and collection practices for the laboratory where the samples The software was unable to confirm the proposed structure evaluation settings for a typical group of samples was set in Figure 1 (ID #8). Upon closer inspection it was Figure 2. ID #3 was a false negative as the software up using a pilot set of 19 compounds. Once these settings were prepared and run. Once the first set was run through observed that the software failed because the experimental was unable to assign the methyl group (highlighted in were adjusted, they were used to automatically process and the system and results of the verification procedure peak located at 4.74 ppm corresponding to atom #11 in the blue) due to slow rotation around the N-CO bond. evaluate a blind set of 10 compounds that were prepared obtained, the second, blind test, was performed on 10 proposed structure had an integration value that was too The presence of this rotamer resulted in an under the same conditions. The results revealed that this distinct datasets (with chemical structures) that were not low to assign correctly. As a result, the software flagged inconsistency between the experimental and completely automated system could reduce the available to the software or the software operators in this result as ambiguous. It was later observed that the low predicted chemical shifts. interpretation workload of a spectroscopist by up to 90% if advance. The details and results of these two tests are presented here, along with a comprehensive look at the integration value could be due to enol formation. A longer problems with rotomers and impurities are filtered out relaxation delay may have more adequately prepared the The software also flagged the sample ID #7 to be before the NMR Verification step, up to 70% when these structures that could not be confirmed. experimental spectrum for automatic evaluation by the considered for closer inspection. In this particular case, problem samples are left in. software. the issue with this spectrum was determined to be based on Setting Up Ideal Processing and the presence of a mixture. Based on some of the spectral This study highlighted several examples where datasets Evaluation Parameters features in both the 1H and HSQC–DEPT spectra, it is were flagged by the software for closer inspection by a In order to have a system that can run without human believed that some of the product had converted to an spectroscopist. These particular examples illustrate the intervention, automated processing and structure alcohol resulting in a mixture of both the brominated and software’s discrimination ability that help reduce the risk verification procedures (macros) must be created in the hydroxylated products. As a result, the software correctly of false positives. The results of this blind study suggested software to perform these tasks. The raw 1D and 2D NMR identified this spectrum as not being consistent with the that a fully automated processing and interpretation system datasets for 19 Aldrich compounds were first evaluated proposed structure and it was flagged for manual analysis. can perform sufficiently in an industrial environment. using ACD/Labs’ standard macros. These settings proved to be non-sufficient as the datasets contained several ACKNOWLEDGEMENTS Br OH abnormally broad water peaks and low signal-to-noise The authors would like to acknowledge Dr. Timothy D. ratios. These macros were then modified to exclude these Spitzer and Randy D. Rutkowske of GlaxoSmithKline for water peaks and set more stringent peak picking guidelines providing us with NMR data for the compounds in this to combat the S/N issues. The second attempt was Figure 1. ID #8 was a false negative because the study. improved but had some issues with the referencing in one integration value for the multiplet at 4.74 ppm was too N N of the 2D datasets. In addition, the 1D spectra were not low. well-resolved, resulting in an inaccurate evaluation of REFERENCES A second compound, ID #11, was rejected by the software Figure 3. ID #7 was flagged as an ambiguous result. 1. Automated Structure Verification Based on 1H NMR some multiplets. These issues were rectified by decreasing Prediction, Sergey S. Golotvin, Eugene Vodopianov, Brent the line broadening setting in the software by a factor of as well. Upon closer inspection of the experimental data, Spectral features in the 1H and HSQC–DEPT dataset it was determined that the purity of this compound was not A. Lefebvre, Antony J. Williams, and Timothy D. Spitzer. 10. Following this modification, the settings were then suggest a mixture between the two compounds sufficient and that the sample contained several different Magn. Reson. Chem. 2006; 44: 524-538. deemed to be sufficient. shown above. components. In these two particular examples, the software did a good job of flagging the two problem 2. Automated Evaluation of a Chemical Structure with The final sample in the blind test set (ID #10) was also Only 1D 1H and 2D 1H–13C HSQC, Sergey S. Golotvin, Results of the First Test spectra that required a closer look. flagged by the software. In this particular case, the An explanation of the combined verification algorithms Eugene Vodopianov, Rostislav Pol, Brent A. Lefebvre, software was unable to identify two protons in the Antony J. Williams, and Timothy D. Spitzer . ENC Poster used to evaluate spectrum-to-structure matches have been Results of the Blind Test experimental spectrum because the software correctly set a previously reported.2 Following the modification of 2006. After the previous results and settings had been agreed dark region over a large water peak. Unfortunately, the ACD/Labs’ standard macros explained in the previous upon, a blind test set of 10 compounds was run through the creation of this dark region resulted in the exclusion of an section, the raw data of the 19 Aldrich compounds were system in the exact same fashion. No changes to the important multiplet in the experimental spectrum that was fully processed and evaluated automatically. processing or verification parameters were made. The in close proximity to the water peak. Because of this dark results of this test are shown in table 2. The results revealed that the software was able to region, the software was unable to confirm a match ID Verification Result successfully evaluate 13 of the 19 datasets provided. In 1 0.90 between the spectrum and structure. other words, for this particular dataset, 69% of the samples 2 0.62 3 0.12 were automatically evaluated by software without any 4 0.99 human intervention. The remaining 6 samples would 5 0.79 110 Yonge Street, 14th floor, Toronto require manual analysis by an NMR Spectroscopist as the 6 0.99 Ontario, Canada M5C 1T4 software had flagged them as being either inconsistent or 7 0.39 8 0.85 Tel: (416) 368-3435 incorrect (Table 1). Of these 6 samples, it was concluded 9 0.92 that 4 of the false negatives were a result of algorithm Fax: (416) 368-5596 10 0.18 errors that have been fixed in Version 10 of the software Toll Free: 1-800-304-3988 (ID# 6, 12, 13, and 15). The other two ambiguous results Table 2. The results of the 10 blind Aldrich datasets. For this dataset, 7 of the 10 datasets (70%) were Email: info@acdlabs.com require a closer look to be explained. automatically evaluated by the software.