SlideShare uma empresa Scribd logo
1 de 3
Baixar para ler offline
Abstract
In transportation the travel surveys are one of the most important ways of obtaining the significant
information needed for transportation planning and decision making for a city, town, or state. These
surveys gather socio-economic, demographics, and trip-making characteristics of individual households;
whether these households have one individual or several. By gaining this information developers can
obtain a plan for travel forecasting using the travel relations to the types of choices, locations, and the
scheduling of daily activities. Travel forecasting is a method of predicting a travel pattern within the
zone, city, or state that is being studied.
The data that I have obtained is from 1996, and it studies the travel of 1668 different households and
18000 individuals. I randomly selected 5000 activities from the full data set to conduct this project.
Using this data, I will explore and answer several questions that might be useful for the planning of city
developers. The first question is whether females will travel further than males. This was done using a
Bayesian technique called Monte Carlo sampling and will use an Exponential distribution. The reason
that this might be important is to see whether a female is more willing to travel out of their zip code to
do certain activities than males are willing to do. This is important for the developers, since they may
decide to build more conveniently towards a female population verses a male population if it is found
that females travel further. The second question is given the gender and distance traveled, what activity
occurred, then comparing these to see which activities are more common for which gender. This was
done using a Bayesian method called Monte Carlo sampling using a Bernoulli distribution. This is
important for city planners that are deciding what types of businesses might be developed in a certain
zone (in our case zip code). The third question is to see whether a female or male is more likely to do a
certain activity given their age. This is also going to be done with a Bayesian technique called Gibbs
sampling and a probit regression. This is important for the city planners because they may be able to
build businesses which might attract a certain age group, and may want to see whether it is wise to do
so in a given area.
Results for Whether a Woman Travels More Than a Man Travels:
After looking at the data, the distances for both genders seemed to follow an exponential distribution
rather than any other distribution. I was able to examine this using a histogram, Figures 1.a for females
and 1.b for males. I decided to log the distances, since there seemed to be a large distance between the
values of the distance, and create a histogram with those plots, Figures 1.c for females and 1.d for
males. Since the plots seemed to have a curve to them, I decided that they must follow an exponential
distribution.
After fitting both sets of data to an exponential distribution, I then created the prior densities of each,
which turned out to both be gammas, and thus their posteriors also were gammas. I chose to have
and I decided to use a unit information prior, since I do not have any prior data to base
my prior on. So, therefore the distributions look like the following:
( )
} { } ∑
( )
} { } ∑
Next, I decided to check whether the data actually fitted an exponential distribution. I decided to do a
posterior predictive check. Out of 10,000 Monte Carlo datasets, about 50% had values of ( ) that
equaled or exceeded and the same was true for the males. Therefore, it appears that the
observed values are likely the result of an exponential model. Hence the exponential model is valid for
the test statistic t for the female distances and male distances. This is also shown with the histograms in
Figure 2.a and 2.b.
Also, I looked at the Monte Carlo mean =0.08 and found that the posterior mean approximately
equaled 0.08, therefore this shows also, that this model is a good fit.
After conducting a Monte Carlo sampling to answer my question, which was is the probability that a
female’s travel distance more than a male’s. To answer the question, I decided to first look at the
empirical probability, which was . Next, I decided to check the posterior
predictive data, which was ( ̃ ̃ ) So, this shows that the distributions of and are
quite similar, according to the scientific question, the probability of females traveling more than males is
0.523. Thus, my question is answered, women technically travel further than men.
Results for what activity, given the age and gender do males do more than females :
Results for what activity, given distance and gender do females do more than males:

Mais conteúdo relacionado

Destaque

Izoimetatosxoleio8 weebly
Izoimetatosxoleio8 weeblyIzoimetatosxoleio8 weebly
Izoimetatosxoleio8 weeblycristosx2012abc
 
oneM2M Personal Connected Healthcare
oneM2M Personal Connected HealthcareoneM2M Personal Connected Healthcare
oneM2M Personal Connected HealthcareoneM2M
 
IoT Seminar (Jan. 2016) - (9) kenneth lowe - fast track your lwm2m developmen...
IoT Seminar (Jan. 2016) - (9) kenneth lowe - fast track your lwm2m developmen...IoT Seminar (Jan. 2016) - (9) kenneth lowe - fast track your lwm2m developmen...
IoT Seminar (Jan. 2016) - (9) kenneth lowe - fast track your lwm2m developmen...Open Mobile Alliance
 
Foreign Institutional Investor project 2013-14
Foreign Institutional Investor project 2013-14Foreign Institutional Investor project 2013-14
Foreign Institutional Investor project 2013-14Vineeth Poliyath
 
Makalah biologi tentang Teknologi pada Sistem Peredaran Darah Kelas XI Semest...
Makalah biologi tentang Teknologi pada Sistem Peredaran Darah Kelas XI Semest...Makalah biologi tentang Teknologi pada Sistem Peredaran Darah Kelas XI Semest...
Makalah biologi tentang Teknologi pada Sistem Peredaran Darah Kelas XI Semest...dimar aji
 
Las curvas logarítmicas y exponenciales.
Las curvas logarítmicas y exponenciales.Las curvas logarítmicas y exponenciales.
Las curvas logarítmicas y exponenciales.madealves
 
PPT SPLDV dengan 3 metode penyelesaian
PPT SPLDV dengan 3 metode penyelesaianPPT SPLDV dengan 3 metode penyelesaian
PPT SPLDV dengan 3 metode penyelesaianYoanna Rianda
 

Destaque (13)

INFEKSI ASAL AIR
INFEKSI ASAL AIRINFEKSI ASAL AIR
INFEKSI ASAL AIR
 
Αυτοκίνητο
ΑυτοκίνητοΑυτοκίνητο
Αυτοκίνητο
 
Aids
AidsAids
Aids
 
Hoc 4 gym
Hoc 4 gym Hoc 4 gym
Hoc 4 gym
 
SISTEM PEREDARAN DARAH
SISTEM PEREDARAN DARAHSISTEM PEREDARAN DARAH
SISTEM PEREDARAN DARAH
 
Izoimetatosxoleio8 weebly
Izoimetatosxoleio8 weeblyIzoimetatosxoleio8 weebly
Izoimetatosxoleio8 weebly
 
Αεροπλάνο
ΑεροπλάνοΑεροπλάνο
Αεροπλάνο
 
oneM2M Personal Connected Healthcare
oneM2M Personal Connected HealthcareoneM2M Personal Connected Healthcare
oneM2M Personal Connected Healthcare
 
IoT Seminar (Jan. 2016) - (9) kenneth lowe - fast track your lwm2m developmen...
IoT Seminar (Jan. 2016) - (9) kenneth lowe - fast track your lwm2m developmen...IoT Seminar (Jan. 2016) - (9) kenneth lowe - fast track your lwm2m developmen...
IoT Seminar (Jan. 2016) - (9) kenneth lowe - fast track your lwm2m developmen...
 
Foreign Institutional Investor project 2013-14
Foreign Institutional Investor project 2013-14Foreign Institutional Investor project 2013-14
Foreign Institutional Investor project 2013-14
 
Makalah biologi tentang Teknologi pada Sistem Peredaran Darah Kelas XI Semest...
Makalah biologi tentang Teknologi pada Sistem Peredaran Darah Kelas XI Semest...Makalah biologi tentang Teknologi pada Sistem Peredaran Darah Kelas XI Semest...
Makalah biologi tentang Teknologi pada Sistem Peredaran Darah Kelas XI Semest...
 
Las curvas logarítmicas y exponenciales.
Las curvas logarítmicas y exponenciales.Las curvas logarítmicas y exponenciales.
Las curvas logarítmicas y exponenciales.
 
PPT SPLDV dengan 3 metode penyelesaian
PPT SPLDV dengan 3 metode penyelesaianPPT SPLDV dengan 3 metode penyelesaian
PPT SPLDV dengan 3 metode penyelesaian
 

Semelhante a Where do Citizens Go in Las Vegas (Bayesian Method Monte Carlo)

Original Research in Current Employment
Original Research in Current EmploymentOriginal Research in Current Employment
Original Research in Current EmploymentCarlos Vasquez
 
GENERATION OF SYNTHETIC POPULATION USING MARKOV CHAIN MONTE CARLO SIMULATION ...
GENERATION OF SYNTHETIC POPULATION USING MARKOV CHAIN MONTE CARLO SIMULATION ...GENERATION OF SYNTHETIC POPULATION USING MARKOV CHAIN MONTE CARLO SIMULATION ...
GENERATION OF SYNTHETIC POPULATION USING MARKOV CHAIN MONTE CARLO SIMULATION ...IJCI JOURNAL
 
Classification via Logistic Regression
Classification via Logistic RegressionClassification via Logistic Regression
Classification via Logistic RegressionTaweh Beysolow II
 
QingyuMaFinalPoster
QingyuMaFinalPosterQingyuMaFinalPoster
QingyuMaFinalPosterQingyu Ma
 
probability versusnonprobsampling
 probability versusnonprobsampling probability versusnonprobsampling
probability versusnonprobsamplingWander Guerra
 
The Effect of Genetic Algorithm Parameters Tuning for Route Optimization in T...
The Effect of Genetic Algorithm Parameters Tuning for Route Optimization in T...The Effect of Genetic Algorithm Parameters Tuning for Route Optimization in T...
The Effect of Genetic Algorithm Parameters Tuning for Route Optimization in T...Muhammad Irfan Kemal
 
Sheet1ManhattanBrooklynQueensThe BronxStaten IslandEducationMarita.docx
Sheet1ManhattanBrooklynQueensThe BronxStaten IslandEducationMarita.docxSheet1ManhattanBrooklynQueensThe BronxStaten IslandEducationMarita.docx
Sheet1ManhattanBrooklynQueensThe BronxStaten IslandEducationMarita.docxbjohn46
 
Comparative StudyReviewer______________________Author of .docx
Comparative StudyReviewer______________________Author of .docxComparative StudyReviewer______________________Author of .docx
Comparative StudyReviewer______________________Author of .docxmonicafrancis71118
 
BOOTSTRAPPING IN STATISTICS
BOOTSTRAPPING IN STATISTICSBOOTSTRAPPING IN STATISTICS
BOOTSTRAPPING IN STATISTICSSuvam Das
 
Analysing a Complex Agent-Based Model Using Data-Mining Techniques
Analysing a Complex Agent-Based Model  Using Data-Mining TechniquesAnalysing a Complex Agent-Based Model  Using Data-Mining Techniques
Analysing a Complex Agent-Based Model Using Data-Mining TechniquesBruce Edmonds
 
Best crime predictor: Linear Regression
Best crime predictor: Linear RegressionBest crime predictor: Linear Regression
Best crime predictor: Linear RegressionJonathan Chauwa
 
CHILDREN IN BARRACKS: ARE THEY SOLDIERS OR FAMILY MEMBERS?
CHILDREN IN BARRACKS: ARE THEY SOLDIERS OR FAMILY MEMBERS?CHILDREN IN BARRACKS: ARE THEY SOLDIERS OR FAMILY MEMBERS?
CHILDREN IN BARRACKS: ARE THEY SOLDIERS OR FAMILY MEMBERS?Carlos Gutierrez Carvajal
 
These are just examples from previous classes not for this week cl.docx
These are just examples from previous classes not for this week cl.docxThese are just examples from previous classes not for this week cl.docx
These are just examples from previous classes not for this week cl.docxchristalgrieg
 
Data Matrix Of Cpi Data Distribution After Transformation...
Data Matrix Of Cpi Data Distribution After Transformation...Data Matrix Of Cpi Data Distribution After Transformation...
Data Matrix Of Cpi Data Distribution After Transformation...Kimberly Jones
 
Analysis_and_Comparison_of_Mathematical_Population_Models[1] [Autosaved]
Analysis_and_Comparison_of_Mathematical_Population_Models[1] [Autosaved]Analysis_and_Comparison_of_Mathematical_Population_Models[1] [Autosaved]
Analysis_and_Comparison_of_Mathematical_Population_Models[1] [Autosaved]James Cain
 
Math1050 Precollege Mathematics I.docx
Math1050 Precollege Mathematics I.docxMath1050 Precollege Mathematics I.docx
Math1050 Precollege Mathematics I.docxstirlingvwriters
 
MEASURING SIMILARITY BETWEEN MOBILITY MODELS AND REAL WORLD MOTION TRAJECTORIES
MEASURING SIMILARITY BETWEEN MOBILITY MODELS AND REAL WORLD MOTION TRAJECTORIESMEASURING SIMILARITY BETWEEN MOBILITY MODELS AND REAL WORLD MOTION TRAJECTORIES
MEASURING SIMILARITY BETWEEN MOBILITY MODELS AND REAL WORLD MOTION TRAJECTORIEScscpconf
 

Semelhante a Where do Citizens Go in Las Vegas (Bayesian Method Monte Carlo) (20)

Original Research in Current Employment
Original Research in Current EmploymentOriginal Research in Current Employment
Original Research in Current Employment
 
GENERATION OF SYNTHETIC POPULATION USING MARKOV CHAIN MONTE CARLO SIMULATION ...
GENERATION OF SYNTHETIC POPULATION USING MARKOV CHAIN MONTE CARLO SIMULATION ...GENERATION OF SYNTHETIC POPULATION USING MARKOV CHAIN MONTE CARLO SIMULATION ...
GENERATION OF SYNTHETIC POPULATION USING MARKOV CHAIN MONTE CARLO SIMULATION ...
 
Classification via Logistic Regression
Classification via Logistic RegressionClassification via Logistic Regression
Classification via Logistic Regression
 
B00624300_AlfredoConetta_EGM716_MAUP_Projectc
B00624300_AlfredoConetta_EGM716_MAUP_ProjectcB00624300_AlfredoConetta_EGM716_MAUP_Projectc
B00624300_AlfredoConetta_EGM716_MAUP_Projectc
 
QingyuMaFinalPoster
QingyuMaFinalPosterQingyuMaFinalPoster
QingyuMaFinalPoster
 
probability versusnonprobsampling
 probability versusnonprobsampling probability versusnonprobsampling
probability versusnonprobsampling
 
The Effect of Genetic Algorithm Parameters Tuning for Route Optimization in T...
The Effect of Genetic Algorithm Parameters Tuning for Route Optimization in T...The Effect of Genetic Algorithm Parameters Tuning for Route Optimization in T...
The Effect of Genetic Algorithm Parameters Tuning for Route Optimization in T...
 
Sheet1ManhattanBrooklynQueensThe BronxStaten IslandEducationMarita.docx
Sheet1ManhattanBrooklynQueensThe BronxStaten IslandEducationMarita.docxSheet1ManhattanBrooklynQueensThe BronxStaten IslandEducationMarita.docx
Sheet1ManhattanBrooklynQueensThe BronxStaten IslandEducationMarita.docx
 
German_Final_Project
German_Final_ProjectGerman_Final_Project
German_Final_Project
 
Comparative StudyReviewer______________________Author of .docx
Comparative StudyReviewer______________________Author of .docxComparative StudyReviewer______________________Author of .docx
Comparative StudyReviewer______________________Author of .docx
 
BOOTSTRAPPING IN STATISTICS
BOOTSTRAPPING IN STATISTICSBOOTSTRAPPING IN STATISTICS
BOOTSTRAPPING IN STATISTICS
 
Analysing a Complex Agent-Based Model Using Data-Mining Techniques
Analysing a Complex Agent-Based Model  Using Data-Mining TechniquesAnalysing a Complex Agent-Based Model  Using Data-Mining Techniques
Analysing a Complex Agent-Based Model Using Data-Mining Techniques
 
Best crime predictor: Linear Regression
Best crime predictor: Linear RegressionBest crime predictor: Linear Regression
Best crime predictor: Linear Regression
 
CHILDREN IN BARRACKS: ARE THEY SOLDIERS OR FAMILY MEMBERS?
CHILDREN IN BARRACKS: ARE THEY SOLDIERS OR FAMILY MEMBERS?CHILDREN IN BARRACKS: ARE THEY SOLDIERS OR FAMILY MEMBERS?
CHILDREN IN BARRACKS: ARE THEY SOLDIERS OR FAMILY MEMBERS?
 
poster
posterposter
poster
 
These are just examples from previous classes not for this week cl.docx
These are just examples from previous classes not for this week cl.docxThese are just examples from previous classes not for this week cl.docx
These are just examples from previous classes not for this week cl.docx
 
Data Matrix Of Cpi Data Distribution After Transformation...
Data Matrix Of Cpi Data Distribution After Transformation...Data Matrix Of Cpi Data Distribution After Transformation...
Data Matrix Of Cpi Data Distribution After Transformation...
 
Analysis_and_Comparison_of_Mathematical_Population_Models[1] [Autosaved]
Analysis_and_Comparison_of_Mathematical_Population_Models[1] [Autosaved]Analysis_and_Comparison_of_Mathematical_Population_Models[1] [Autosaved]
Analysis_and_Comparison_of_Mathematical_Population_Models[1] [Autosaved]
 
Math1050 Precollege Mathematics I.docx
Math1050 Precollege Mathematics I.docxMath1050 Precollege Mathematics I.docx
Math1050 Precollege Mathematics I.docx
 
MEASURING SIMILARITY BETWEEN MOBILITY MODELS AND REAL WORLD MOTION TRAJECTORIES
MEASURING SIMILARITY BETWEEN MOBILITY MODELS AND REAL WORLD MOTION TRAJECTORIESMEASURING SIMILARITY BETWEEN MOBILITY MODELS AND REAL WORLD MOTION TRAJECTORIES
MEASURING SIMILARITY BETWEEN MOBILITY MODELS AND REAL WORLD MOTION TRAJECTORIES
 

Mais de Anna Mathis

Hire verses Overtime Analysis
Hire verses Overtime AnalysisHire verses Overtime Analysis
Hire verses Overtime AnalysisAnna Mathis
 
CostBenefitAnalysis
CostBenefitAnalysisCostBenefitAnalysis
CostBenefitAnalysisAnna Mathis
 
Example Performance Report
Example Performance ReportExample Performance Report
Example Performance ReportAnna Mathis
 
All About Companies
All About CompaniesAll About Companies
All About CompaniesAnna Mathis
 
Mathematical Formula to Find Net Premium
Mathematical Formula to Find Net PremiumMathematical Formula to Find Net Premium
Mathematical Formula to Find Net PremiumAnna Mathis
 

Mais de Anna Mathis (7)

Hire verses Overtime Analysis
Hire verses Overtime AnalysisHire verses Overtime Analysis
Hire verses Overtime Analysis
 
CostBenefitAnalysis
CostBenefitAnalysisCostBenefitAnalysis
CostBenefitAnalysis
 
Example Performance Report
Example Performance ReportExample Performance Report
Example Performance Report
 
All About Companies
All About CompaniesAll About Companies
All About Companies
 
Kanban Queue
Kanban QueueKanban Queue
Kanban Queue
 
Mathematical Formula to Find Net Premium
Mathematical Formula to Find Net PremiumMathematical Formula to Find Net Premium
Mathematical Formula to Find Net Premium
 
Portfolio
PortfolioPortfolio
Portfolio
 

Where do Citizens Go in Las Vegas (Bayesian Method Monte Carlo)

  • 1. Abstract In transportation the travel surveys are one of the most important ways of obtaining the significant information needed for transportation planning and decision making for a city, town, or state. These surveys gather socio-economic, demographics, and trip-making characteristics of individual households; whether these households have one individual or several. By gaining this information developers can obtain a plan for travel forecasting using the travel relations to the types of choices, locations, and the scheduling of daily activities. Travel forecasting is a method of predicting a travel pattern within the zone, city, or state that is being studied. The data that I have obtained is from 1996, and it studies the travel of 1668 different households and 18000 individuals. I randomly selected 5000 activities from the full data set to conduct this project. Using this data, I will explore and answer several questions that might be useful for the planning of city developers. The first question is whether females will travel further than males. This was done using a Bayesian technique called Monte Carlo sampling and will use an Exponential distribution. The reason that this might be important is to see whether a female is more willing to travel out of their zip code to do certain activities than males are willing to do. This is important for the developers, since they may decide to build more conveniently towards a female population verses a male population if it is found that females travel further. The second question is given the gender and distance traveled, what activity occurred, then comparing these to see which activities are more common for which gender. This was done using a Bayesian method called Monte Carlo sampling using a Bernoulli distribution. This is important for city planners that are deciding what types of businesses might be developed in a certain zone (in our case zip code). The third question is to see whether a female or male is more likely to do a certain activity given their age. This is also going to be done with a Bayesian technique called Gibbs sampling and a probit regression. This is important for the city planners because they may be able to build businesses which might attract a certain age group, and may want to see whether it is wise to do so in a given area. Results for Whether a Woman Travels More Than a Man Travels:
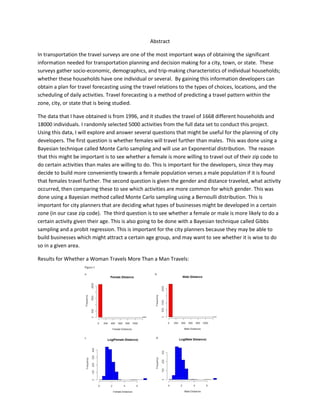
  • 2. After looking at the data, the distances for both genders seemed to follow an exponential distribution rather than any other distribution. I was able to examine this using a histogram, Figures 1.a for females and 1.b for males. I decided to log the distances, since there seemed to be a large distance between the values of the distance, and create a histogram with those plots, Figures 1.c for females and 1.d for males. Since the plots seemed to have a curve to them, I decided that they must follow an exponential distribution. After fitting both sets of data to an exponential distribution, I then created the prior densities of each, which turned out to both be gammas, and thus their posteriors also were gammas. I chose to have and I decided to use a unit information prior, since I do not have any prior data to base my prior on. So, therefore the distributions look like the following: ( ) } { } ∑ ( ) } { } ∑ Next, I decided to check whether the data actually fitted an exponential distribution. I decided to do a posterior predictive check. Out of 10,000 Monte Carlo datasets, about 50% had values of ( ) that equaled or exceeded and the same was true for the males. Therefore, it appears that the observed values are likely the result of an exponential model. Hence the exponential model is valid for the test statistic t for the female distances and male distances. This is also shown with the histograms in Figure 2.a and 2.b. Also, I looked at the Monte Carlo mean =0.08 and found that the posterior mean approximately equaled 0.08, therefore this shows also, that this model is a good fit. After conducting a Monte Carlo sampling to answer my question, which was is the probability that a female’s travel distance more than a male’s. To answer the question, I decided to first look at the empirical probability, which was . Next, I decided to check the posterior
  • 3. predictive data, which was ( ̃ ̃ ) So, this shows that the distributions of and are quite similar, according to the scientific question, the probability of females traveling more than males is 0.523. Thus, my question is answered, women technically travel further than men. Results for what activity, given the age and gender do males do more than females : Results for what activity, given distance and gender do females do more than males: