

Recomendados
Recomendados
Mais conteúdo relacionado
Mais procurados
Mais procurados (18)
Destaque
Semelhante a Speciation prez
Semelhante a Speciation prez (20)
Último
Último (20)
Speciation prez
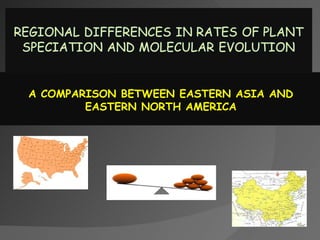
- 1. A COMPARISON BETWEEN EASTERN ASIA AND EASTERN NORTH AMERICA
- 2. Introduction Biodiversity anomaly explaining differences in species diversity between regions with similar environments Most studies have emphasized the relationship between species richness and local environment However, significant region effects on species richness have been reported in comparisons of biota between different parts of the world with comparable environments Eastern Asia (EAS) and eastern North America (ENA) considered a prominent case of biodiversity anomalies as they are highly similar in climate, but differ in species richness
- 3. Introduction The pattern of biotic similarity between EAS and ENA is fully studied and documented Several paleontological and phylogenetic analyses suggest that this phytogeographic pattern has a complex history The US and China are similar in area, but China has a more diverse flora, 18,000 vs. 29,200 species of vascular plants and a higher proportion of endemic taxa Analyses of molecular phylogeny, divergence times, and biogeography of selected extant lineages have revealed that disjunctions often involved intercontinental distribution across land bridges
- 4. Introduction Speciation is considered to depend on genetic changes at the DNA level allowing population to diverge However, relationship between rates of speciation and molecular evolution has long been debated Several recent studies revealed +ve correlation between rates of species diversity and molecular evolution, providing evidence for a link between rates of molecular evolution and speciation
- 5. Goals of Study To determine whether net speciation rates differ between the two regions To compare rates of molecular evolution between the two regions and examine whether rate of species diversity is linked with rate of molecular evolution Through Phylogenetic analyses of ITS sequences for 10 flowering plant genera to identify EAS–ENA sister clades Then compare species diversity and rates of molecular evolution between the sister lineages
- 6. MATERIALS AND METHODS Sampling 10 genera selected, based on DNA sequence data published in previous phylogenetic studies, each of which holds at least one pair of sister clades disjuncted between EAS and ENA
- 7. MATERIALS AND METHODS Phylogenetic Analyses and Branch Length Estimation ITS sequence data for 270 species from the 10 genera were obtained from the original authors or downloaded from Genbank, aligned then adjusted by eye Phylogenetic analyses were performed separately for each genus to confirm disjunct sister pairs in EAS and ENA and to reconstruct the branch lengths leading to each counterpart of the sister pairs Branch lengths of sister lineages reflect their relative rates of sequence change. Thus, the lineage with the longer branch must have experienced a faster rate of nucleotide changes
- 8. Phylogenetic Analyses and Branch Length Estimation Maximum-likelihood (ML) method were used to perform the phylogenetic analyses and to estimate branch lengths in sister lineages While Modeltest used to determine the best model of ITS evolution for each genus Branch lengths within each sister clade were calculated by hand using the mean path lengths method (Britton et al. 2002) Heuristic searches with random taxon addition of 10 replicates were conducted to find the best ML tree for each genus under the best-fit model ML bootstrap analyses of 100 replicates were performed for each genus to estimate the support for the sister clades
- 9. Sampling information, species richness, and relative branch lengths in sister pairs of clades An asterisk indicates the number of species from the EAS–ENA disjunct subgroup of Cornus (Cornus subg. Mesomora)
- 10. MATERIALS AND METHODS Statistical Analyses They conducted a regression analysis of path length to assess the relationship between rate of molecular evolution (branch lengths) and species richness N =number of combinations; R = region with higher rate of ITS evolution in analysis of complete dataset; T = times full analysis was supported; P = result of one tailed sign test
- 11. RESULTS Phylograms showing EAS–ENA sister clades EAS species are presented in red and ENA species are in blue Nodes uniting the sister clades are indicated by solid circles Branch lengths between the sisters correspond to relative ITS rates Bootstrap support is indicated for the node uniting the sister pairs and for the basal node uniting species within each sister clade
- 13. RESULTS & DISCUSSION Longer branch lengths and greater species richness in the eastern Asian counterparts for a majority of the pairs of EAS–ENA sister clades, 7out of 10 pairs (70%) Positive relationship between species richness and branch length The higher rate of change in ITS sequences in EAS clades provides support for more rapid speciation in eastern Asia Most genera evolved and initially diversified in one region, followed by subsequent spread into the other, either by long distance dispersal or gradual migration across a land bridge
Notas do Editor
- Net rate of diversification (speciation minus extinction)
- Rate of speciation is affected by both environmental and biological attributes Factors promoting speciation include: Abundant topographic barriers (splitting the ancestral species’ range, preventing gene flow, enhancing founder effect , etc.), Strong sexual selection (leading to divergence in mate recognition systems ), Ecological specialization (limiting population distribution and fostering divergence ), Low dispersal rates (reducing gene flow among populations ), and Bottlenecks in population size (facilitating genetic peak shifts)