SlideShare uma empresa Scribd logo
1 de 35
Baixar para ler offline
Simple Moving Averages: A Ten-Year Test

                                  by

                           Eric M. Wilder


                              A Project

                             Submitted to

                       Oregon State University

                      University Honors College


                        in partial fulfillment of
                       the requirements for the
                               degrees of

Honors Baccalaureate of Science in Civil Engineering (Honors Scholar)

Honors Baccalaureate of Science in Forest Engineering (Honors Scholar)


                      Presented May 28, 2009
                     Commencement June 2009
AN ABSTRACT OF THE THESIS OF

Eric M. Wilder for the degrees of Honors Baccalaureate of Science in Civil Engineering and
Honors Baccalaureate of Science in Forest Engineering presented on May 28, 2009. Title:
Simple Moving Averages and the Stock Market


Abstract Approved:

                                                    Jimmy Yang


       The intent of this thesis is to prove whether or not simple moving averages can be

used to predict the future price performance of stocks and outperform the buy-and-hold

method of investing in the stock market. The importance of this research is that if moving

averages can predict future price performance then they could be used as a way to gain an

advantage when investing in the stock market. Historical prices for 29 of the 30 stocks

currently in the Dow Jones Industrial Average were used to empirically test a variety of

moving average criteria to buy and sell stocks to see if the buy-and-hold method could be

outperformed. It was found that the moving averages tested could not compete with the buy-

and-hold method and that historical price movements could not predict future performance.

The results in this thesis provided further evidence for the Efficient Market Hypothesis and

the Random Walk Hypothesis and demonstrated that moving averages may not be a valid

and successful way to invest in the stock market.


Key Words: Stock Market, Efficient Market, Random Walk, Moving Average, Technical
Analysis

Corresponding e-mail address: wildere@onid.orst.edu
©Copyright by Eric M. Wilder
       May 28, 2009
   All Rights Reserved
Simple Moving Averages: A Ten-Year Test

                                  by

                           Eric M. Wilder


                              A Project

                             Submitted to

                       Oregon State University

                      University Honors College


                        in partial fulfillment of
                       the requirements for the
                               degrees of

Honors Baccalaureate of Science in Civil Engineering (Honors Scholar)

Honors Baccalaureate of Science in Forest Engineering (Honors Scholar)


                      Presented May 28, 2009
                     Commencement June 2009
Honors Baccalaureate of Science in Civil Engineering and Honors Baccalaureate of Science in
Forest Engineering project of Eric M. Wilder presented on May 28, 2009.


APPROVED:


Mentor, representing Finance


Committee Member, representing Civil and Construction Engineering


Committee Member, representing Finance


Dean, University Honors College


I understand that my project will become part of the permanent collection of Oregon State
University, University Honors College. My signature below authorizes release of my project to
any reader upon request.


                                    Eric M. Wilder, Author
Table of Contents

                                                                                                                                         Page

Section I

       Introduction..........................................................................................................................1

       Past Study.............................................................................................................................1

Section II

       Literature Review .................................................................................................................3

       Technical Analysis vs. Fundamental Analysis .....................................................................4

       Random Walk vs. Efficient Market.......................................................................................4

Section III

       Importance ...........................................................................................................................6

Section IV

       Methodology ........................................................................................................................8

Section V

       Results ................................................................................................................................13

       Conclusion .........................................................................................................................15

Appendix

       Final Balances per Stock ...................................................................................................18
List of Figures

Figure                                                                                                                     Page

3.1      Sample Moving Average Chart ............................................................................................6

5.1      Combined Final Balances Compared to Buy-and-Hold ....................................................14
List of Tables

Table                                                                                                                       Page

4.1     The 30 Stocks of the Dow Jones ...........................................................................................9

4.2     Sample Moving Average Calculations ...............................................................................10

4.3     Average Number of Trades per Year .................................................................................10

4.4     Combined Final Balances with $1,000 Initial Investments ...............................................12

5.1     Combined Final Balances with $10,000 Initial Investments .............................................14
Simple Moving Averages: A Ten-Year Test


Section I


Introduction


       This thesis was written with the intention of discovering if using certain basic technical

analysis methods for investing in the stock market can yield higher returns, on average, than a

simple buy-and-hold strategy. The type of technical analysis used was the crossing of moving

averages; this method of investing was empirically tested with historical prices. Moving averages

are a type of technical analysis that have been used to analyze trends in the stock market and

signify when a stock should be bought or sold. A moving average is the average price of a stock

over a specified duration, typically 5, 20, 100, 150 or 200-days. It is commonly believed among

technical analysts that this method will yield higher returns and help reduce losses when

investing in the stock market. The research completed for this thesis was used to explore the

validity of this claim. Two types of moving average methods were used; first was the crossing of

two moving averages and second was the crossing of a moving average with the price of the

particular stock, with a given threshold.


Similar Past Study


        In 1967, an article was written by Van Horne and Parker called “The Random-Walk

Theory: An Empirical Test,” in which a study was conducted to see if there was a correlation

between past price movements and future prices of stocks. A simulated $10,000 was invested in
2

each of the thirty chosen stocks and they were analyzed from October 17, 1960 to June 30, 1966.

The 30 stocks were chosen at random with no selection criteria. In this article stocks were bought

and sold based on the price crossing three different moving averages, 200 days, 150 days, and

100 days. Five different thresholds were used for each of the three moving averages; 0, 2, 5, 10,

and 15%. For example, this would mean that for a 200-day moving average and a ten percent

threshold, the stock price must move ten percent above the 200-day moving average before it

was bought. There are two main reasons for using thresholds, the first is to help minimize risk

and the second is the higher the threshold the less trades that need to be made (Van Horne and

Parker 1967).

       It was found by Van Horne and Parker that the buy-and-hold strategy yielded better

returns than any of the moving average and threshold combinations. The basis of this thesis was

to conduct a similar study using the methodology listed above with more recent stocks and prices

to see if past price behavior has more of a correlation with future prices than it did in the 1960’s.
3


Section II


Literature Review


       Haug and Hirschey (2006) researched a trend known as the January effect. In their article

they presented evidence that during the month of January the average return in the stock market

was nearly 3.5 percent and returned only 0.42 percent per month during the rest of the year from

1904 to 1974. Their overall conclusion was this: “A January effect in equal-weighted returns

remains today that is both statistically significant and economically meaningful.” Although this

does not bear any direct meaning for technical analysis it does shed light on whether or not

patterns do exist in the stock market and whether they can be used to make a profit (Haug and

Hirschey 2006).

       Fama’s (1965) article, titled Random Walks in Stock Market Prices, discusses how

random walks affect technical analysis and what must be done by analysts to prove that technical

analysis actually works. “The empirical evidence to date provides strong support for the random

walk model. In this light the only way the chartist can vindicate his position is to show that he

can consistently use his techniques to make better than chance predictions of stock prices. It is

not enough for him to talk mystically about patterns that he sees in the data. He must show that

he can consistently use these patterns to make meaningful predictions of future prices (Fama

1965).”

       This gets at the essence behind the research done in this thesis, to see if the patterns do

exist and if they can lead to higher returns. For technical analysis to hold any weight as an

investment strategy it must be proven that it can actually yield higher profits than just buying and

holding a stock. By completing an empirical study of past price movements and their correlation
4

to future prices it should become clear whether a correlation exists between past and future

prices of stocks.


Technical Analysis vs. Fundamental Analysis


       This study focused solely on technical analysis for trading rules. Technical analysis is the

use of past price history or trends to predict future price performance. Moving averages are just

one of the many ways that can be used to indicate the beginning or ending of a trend in price

movement. Technical analysis differs from fundamental analysis in that fundamental analysis

uses information about a particular stock to analyze earnings and attempt to predict future

performance based on information about past and estimated future fundamentals of stocks.


Random Walk vs. Efficient Market


       The Random Walk Hypothesis states that the market cannot be predicted based on past

performance and that price changes are purely random. The definition of the Random Walk

Hypothesis and how it relates to technical analysis is as follows: “The basic random walk theory

constitutes a refutation of technical analysis and simply states that successive stock price changes

are statistically independent, and that historical stock price movements will, therefore, convey no

information concerning future stock price movements (Jones 1973).”

       The Efficient Market Hypothesis is correlated to the Random Walk Hypothesis and is

based on the belief that stock prices fully reflect all known information. This means that any

information that an investor believes can be used to turn a profit is essentially useless, because

this information is already fully reflected in the price of the stock (Fama 1991). The investigation
5

of moving averages is an inquiry of both the Efficient Market Hypothesis and the Random Walk

Hypothesis in trying to prove that stock prices are not random and can be predicted based on past

price movements. Technical analysts typically do not believe in the Random Walk Hypothesis

because they believe prices can be used as buy and sell indicators and that price movements are

not random.

       Using basic technical analysis to empirically test stocks and see if the price movements

could have been predicted, will either build more evidence that the Efficient Market Hypothesis

and the Random Walk Hypothesis may hold true, or indicate that future stock prices can be

predicted using historical price movements. If this is true, then moving averages can be used to

yield higher returns than buy-and-hold.
6


Section III


Importance


        The importance of this study is to find out if moving averages are a better method for

investing in the stock market, than a simple buy-and-hold strategy. One reason for looking at

this particular method of technical analysis is that it is easy for any level of investor to

incorporate simple moving averages in their trading criteria. Moving average charts can be found

for free on many financial websites, such as Yahoo Finance or MSN Money. An example of a

price history chart with moving averages can be seen in Figure 3.1. When the 5-day moving

average crosses above the 20-day moving average that is a buy signal, and the sell signal is

indicated when the 5-day moving average crosses below the 20-day moving average. This rule is

based on the belief that the stock price is gaining momentum when the 5-day average crosses

above the 20-day average and the stock price is losing momentum when the 20-day average

crosses above the 5-day average.


                            Buy
                                                Sell
                                                              Buy


     Sell


Figure 3.1: Sample Moving Average Chart
7

       Figure 3.1 demonstrates how thresholds can help reduce risk when using moving

averages. Without a threshold the first buy would have led to a purchase of the stock for about

$48 per share and then sold for about $46 per share. This would have been a loss of $2 per share.

The first buy would have been prevented if a threshold was imposed and the 5-day moving

average was required to move at least 2% above the 20-day moving average. The stock would

have then only been purchased on the second buy signal for about $44 per share.

       By empirically testing these methods of investing it will become more apparent if

technical analysis works and if investors should use moving averages as investment strategies. If

the trading criteria tested do not yield higher returns and the buy-and-hold method yields better

results, then it will be clear that investors should use the buy-and-hold strategy rather than

technical analysis when investing in the stock market and that the Efficient Market Hypothesis

and the Random Walk Hypothesis may be true.
8


Section IV


Methodology


       The methodology used in this thesis was done with the intention to conduct a similar

study to that of Van Horne and Parker (1967), with more contemporary stocks and prices, to see

if past price behavior has more of a correlation with future prices than it did in the 1960’s. The

initial plan was to invest $10,000 in each of the 30 stocks in the Dow Jones Industrial Average

from January 2, 1998 to January 2, 2008. The reason for choosing stocks contained in the Dow

Jones was to try and get a sample of stocks representative of what the average investor is likely

to invest in and have some familiarity with. Since Kraft Foods Inc. has only been publicly traded

since 2001; it did not meet the desired ten-year study period, so its price history data was not

used in this study. Each of the other 29 stocks that were studied were all traded based on 18

different criteria, buy-and-hold, the crossing of 20-day and 5-day moving averages, the crossing

of 200-day and 20-day moving averages, and the stock price crossing the 100, 150, and 200-day

moving averages with 0, 2, 5, 10, and 15% thresholds. The 18 different criteria applied to 29

stocks for a total of 522 different tests. The buy-and-hold strategy simulates the use of $10,000 to

buy as many shares as possible for each stock on January 2, 1998 and holds for the entire ten-

year study period and sells on the final day, January 2, 2008. The 30 stocks of the Dow Jones can

be found in Table 4.1 below:
9

Table 4.1: The 30 Stocks of the Dow Jones
 Symbol-Name             Symbol-Name              Symbol-Name
 AA-Alcoa                GM-General Motors        MMM-3M
 AXP-American Express    HD-Home Depot            MRK-Merck
 BA-Boeing               HPQ-Hewlett Packard      MSFT-Microsoft
 BAC-Bank of America     IBM-IBM                  PFE-Pfizer
 C-Citigroup             INTC-Intel               PG-Proctor & Gamble
 CAT-Caterpillar         JNJ-Johnson & Johnson    T-AT&T
 CVX-Chevron             JPM-JP Morgan            UTX-United Tech
 DD-Du Pont              KFT-Kraft*               VZ-Verizon
 DIS-Disney              KO-Coca Cola             WMT-Wal-Mart
 GE-General Electric     MCD-McDonalds            XOM-Exxon
*Not used in study
       To incorporate splits and dividends over the ten year study period, the adjusted closing

price of the stocks were used for the analysis. Each stock was bought and sold based on the

criteria listed above, if a stock was still held when the study period ended on January 2, 2008, the

stock was sold at the adjusted closing price on that day. The price history used in the analysis for

all 29 stocks was downloaded from the Yahoo! Finance website. If the stock was to be bought or

sold it would be done at the closing price of the day after the moving averages crossed. The

closing price is not always the ideal price to use for analysis, as the closing price has a tendency

to be either the high or the low stock price for the day (Boldt and Arbit 1984). In this instance the

closing prices were the only price history data that was available as an adjusted price for splits

and dividends. It is believed that since so many stocks were analyzed, the bias presented by only

using the closing prices would average out to a good representation of the stock price.

       Once all of the historical prices were collected and reduced down to the required

timeframe, I calculated all of the required moving averages for each stock using the adjusted

closing prices. For example, a 5-day moving average for a particular day would be calculated by

averaging that day’s closing price and the previous four day’s closing price. In Table 4.2 below

example formulas for calculating moving averages in Excel can be found:
10

Table 4.2: Sample Moving Average Calculations
 Day       Price            5-Day MA
  1    $   30.56                -
  2    $   31.02                -
  3    $   33.65                -
  4    $   32.87                -
  5    $   31.54       =AVERAGE(Day 1:Day 5)
  6    $   30.99       =AVERAGE(Day 2:Day 6)
  7    $   29.87       =AVERAGE(Day 3:Day 7)
  8    $   29.66       =AVERAGE(Day 4:Day 8)
  9    $   30.44       =AVERAGE(Day 5:Day 9)
 10    $   28.74       =AVERAGE(Day 6:Day 10)

       Transaction fees were included and assumed to be ten dollars per trade. In Table 5.1, in

the results section, the final balance with transaction fees and the final balance without

transaction fees can be found. The inclusion of transaction fees had no major effect on the final

results; the reason is that before the fees were included, the buy-and-hold method yielded the

highest closing balance, while utilizing the fewest trades. The average number of trades per year

for each trading rule can be found in the Table 4.3 below:

Table 4.3: Average Number of Trades per Year
     Rule          Trades/yr     Rule    Trades/yr     Rule       Trades/yr
 Buy & Hold           0.2      100-10%      1.3      150-15%         0.8
 5 x 20              16.2      100-15%      0.8      200-0%         10.2
 20 x 200             2.5      150-0%      11.7      200-2%          3.8
 100-0%              14.4      150-2%       4.2      200-5%          2.0
 100-2%               5.1      150-5%       2.2      200-10%         1.0
 100-5%               2.7      150-10%      1.1      200-15%         0.8

       In the Table 4.3 the nomenclature is as follows, “5 x 20” is the 5-day moving average

crossing the 20-day moving average and the “100-0%” is the 100-day moving average crossing

the stock price with a 0% threshold. Including the trading fees did not change any of the results

of this study, but could have had a significant effect if less money were to be invested in each of

the 29 stocks. For example, if $1,000 were invested initially in each stock, instead of $10,000,
11

then the moving averages would yield even less money than they did, because the trading fees

would have a much more significant impact on the final net balance.

       The result of only investing $1,000 in each stock initially are shown below in Table 4.4.

In this case, the transaction fees were subtracted off the final balances for each stock, so in some

instances the fees were actually greater than the final balance. This resulted in negative final

balances for two of the trading criteria, the 5-day crossed with the 20-day moving average and

the 100-day moving average with no threshold. It is not possible to have a negative final balance,

because in a real trading account the fees would be taken out as the trades occurred and the

account balance would eventually just go to zero. The $1,000 investments were not initially part

of this study and it was not anticipated that the transaction fees would have such an adverse

effect on the final balances of each stock; otherwise the fees would have been incorporated as

each trade was made. The significance would be that transaction fees have the potential to be a

major downfall of technical analysis, especially if the principal invested is not great enough to

warrant so many transactions, particularly in the case of trading criteria that require frequent

trades. An example of this is the 5-day moving average crossed with the 20-day moving average

trading criteria. This method averaged 16 trades per year, which is an average cost of $160 per

year in trading fees, with only a $1,000 initial investment that is a large percentage of the

investment lost just because of transaction fees
12

Table 4.4: Combined Final Balances with $1,000 Initial Investments
                Gross Balance   Net Balance
Buy-and-Hold    $   60,433.69    $    59,853.69
5 x 20          $   33,108.43    $   (13,891.57)
20 x 200        $   40,659.57    $    33,419.57
100-0%          $   31,616.83    $   (10,083.17)
100-2%          $   36,034.72    $    21,184.72
100-5%          $   38,754.93    $    30,894.93
100-10%         $   41,303.45    $    37,403.45
100-15%         $   39,473.04    $    37,093.04
150-0%          $   34,313.26    $       393.26
150-2%          $   37,254.07    $    24,934.07
150-5%          $   38,579.12    $    32,059.12
150-10%         $   44,888.17    $    41,588.17
150-15%         $   39,662.93    $    37,342.93
200-0%          $   36,421.69    $     6,701.69
200-2%          $   38,528.80    $    27,528.80
200-5%          $   37,446.45    $    31,746.45
200-10%         $   46,807.39    $    43,947.39
200-15%         $   41,714.99    $    39,514.99
13


Section V


Results


          The results of this study are consistent with those from Van Horne and Parker (1967), in

which no technical trading method yielded higher results than the buy-and-hold method. This is

also consistent with the Random Walk Hypothesis and the Efficient Market Hypothesis, where it

appears that future price performance cannot be predicted based on historical price movements

alone. In Table 5.1 below the results for the total value of each trading technique can be seen:

Table 5.1: Combined Final Balances with $10,000 Initial Investments
                 Gross Balance     Net Balance
 Buy-and-Hold     $ 607,723.61     $ 607,143.61
 5 x 20           $ 331,447.35     $ 284,447.35
 20 x 200         $ 407,250.07     $ 400,010.07
 100-0%           $ 315,570.22     $ 273,870.22
 100-2%           $ 360,469.33     $ 345,619.33
 100-5%           $ 387,675.62     $ 379,815.62
 100-10%          $ 414,034.21     $ 410,134.21
 100-15%          $ 394,338.68     $ 391,958.68
 150-0%           $ 342,789.25     $ 308,869.25
 150-2%           $ 372,058.41     $ 359,738.41
 150-5%           $ 386,031.88     $ 379,511.88
 150-10%          $ 449,651.92     $ 446,351.92
 150-15%          $ 397,370.03     $ 395,050.03
 200-0%           $ 364,210.36     $ 334,490.36
 200-2%           $ 385,641.13     $ 374,641.13
 200-5%           $ 374,641.02     $ 368,941.02
 200-10%          $ 469,288.11     $ 466,428.11
 200-15%          $ 417,441.36     $ 415,241.36

          Using the buy-and-hold strategy a final gross balance of $607,723.61 was accumulated,

this is equivalent to an annual compounded rate of return of 7.1%. The highest gross balance

accumulated by any one of the technical trading rules was using the 200-day moving average

with a ten percent threshold and this method accumulated $469,288.11, nearly $130,000 less
14

than the buy-and-hold over the span of ten years, this is equivalent to a rate of return of 3.4%.

This result is important because it is now clearer that moving averages cannot be used to predict

future price movements and that price movements may indeed be a random walk. Including

transaction fees, the net balances for these methods were $607,143.61 and $466,428.11,

respectively.

                   In Figure 5.1, the net balance for each trading rule are plotted in a column chart with the

buy-and-hold balance plotted as a line across the top to compare just how close the technical

trading rules were to competing with the buy-and-hold method. Something noteworthy can be

seen on this figure, the trend that the final balances of the trading rules with thresholds follow.

They tend to peak at the moving averages used with a ten percent threshold. This means that if

moving averages are to be used they should be used with a ten percent threshold. This compares

with the results from Van Horne and Parker (1967) in that their findings had the highest returns

for all moving averages with 10% thresholds.


                                                  Net Balance
                   $700,000.00
                                                         Buy and Hold = $607,143.61
                   $600,000.00

                   $500,000.00                100-day               150-day              200-day
   Final Balance


                   $400,000.00

                   $300,000.00

                   $200,000.00

                   $100,000.00

                           $-


                                                              Trading Criteria

Figure 5.1: Combined Final Balances Compared to Buy-and-Hold
15


Conclusion


       The results from this empirical research support the Random Walk Hypothesis and the

Efficient Market Hypothesis, in that the stock prices in this study could not be predicted based on

past performance and it is more lucrative to use the buy-and-hold method over technical trading

rules. Another significance is that technical trading rules and programs seen on television that

advertise surefire methods for investing in the stock market may not be as lucrative as they are

portrayed to be. The most important thing to be taken away from the finding in this study is that

amateur investors should stick to a simple buy-and-hold method for investing their money in the

stock market. If moving averages are to be used by investors, then based on this study and the

results from Van Horne and Parker (1967), investors who do not use the buy-and-hold method

and are using moving averages, should use a 200-day moving average with a ten percent

threshold.

       One limitation of this study was the lack of investing opportunities for the cash that is

held when not invested in the market. The reason for not assuming an investment opportunity for

cash was that the margin of difference between the balances of the buy-and-hold method and any

of the technical trading rules was so great that the cash investments would have made no

significant difference in the final results. Another limitation of this study is that the Dow Jones

Industrial Average contains highly traded large cap stocks and the results from this study may

have been drastically different for stocks with different market capitalizations.
16


                                         Bibliography

Boldt, Bob L., Hal L. Arbit. "Efficient Markets and the Professional Investor." Financial
       Analysts Journal July-August (1984): 22-34.

Fama, Eugene F. "Efficient Capital Markets II." The Journal of Finance XLVI(1991): 1575-

       1617

Fama, Eugene F. "Random Walks in Stock Market Prices." Financial Analysts Journal
      September-October (1965): 55-59.

Haug, Mark, Mark Hirschey. "The January Effect." Financial Analysts Journal September-
      October (2006): 68-88.

Jones, Charles P. "Earnings Trends and Investment Selection." Financial Analysts Journal
       March-April (1973): 79-85.

Van Horne, James C., George G. C. Parker. "The Random-Walk Theory: An Empirical Test."
      Financial Analysts Journal November-December (1967): 87-92.
17


       Appendix

Final Balances per Stock
18


                     AA-Alcoa              AXP-American Express
             Gross Balance Net Balance   Gross Balance Net Balance
Buy and Hold $      24,470 $ 24,450      $      21,520 $ 21,500
5 x 20       $       4,785 $    3,205    $       8,652 $    6,752
20 x 200     $      17,131 $ 16,891      $      13,231 $ 12,971
100-0%       $       9,929 $    8,329    $       8,062 $    6,422
100-2%       $       8,809 $    8,109    $      10,792 $ 10,272
100-5%       $      13,455 $ 13,155      $      17,216 $ 16,996
100-10%      $      17,338 $ 17,198      $      15,887 $ 15,767
100-15%      $      18,813 $ 18,733      $      11,236 $ 11,136
150-0%       $      10,294 $    9,134    $       8,045 $    6,645
150-2%       $      12,323 $ 11,863      $       9,019 $    8,499
150-5%       $      14,315 $ 14,075      $      17,708 $ 17,528
150-10%      $      15,570 $ 15,450      $      12,974 $ 12,874
150-15%      $      17,738 $ 17,658      $       9,536 $    9,436
200-0%       $      12,063 $ 10,923      $       7,316 $    5,916
200-2%       $      14,989 $ 14,489      $       9,413 $    8,933
200-5%       $      11,553 $ 11,333      $      12,215 $ 12,035
200-10%      $      18,901 $ 18,801      $      13,256 $ 13,156
200-15%      $      15,141 $ 15,061      $      11,308 $ 11,228

                     BA-Boeing             BAC-Bank of America
             Gross Balance Net Balance   Gross Balance Net Balance
Buy and Hold $      20,605 $ 20,585      $      19,589 $ 19,569
5 x 20       $      17,222 $ 15,842      $       9,948 $    8,188
20 x 200     $      16,653 $ 16,473      $       9,814 $    9,574
100-0%       $      13,756 $ 12,596      $      10,748 $    9,568
100-2%       $      13,968 $ 13,468      $       9,407 $    8,927
100-5%       $      23,762 $ 23,562      $       9,725 $    9,485
100-10%      $      13,421 $ 13,241      $       7,188 $    7,048
100-15%      $      18,138 $ 18,038      $       6,231 $    6,151
150-0%       $      20,056 $ 19,156      $       7,411 $    6,411
150-2%       $      16,770 $ 16,410      $       7,045 $    6,565
150-5%       $      13,296 $ 13,096      $       6,204 $    5,944
150-10%      $      15,495 $ 15,355      $       8,413 $    8,293
150-15%      $      23,963 $ 23,883      $       5,791 $    5,691
200-0%       $      21,231 $ 20,631      $       8,283 $    7,243
200-2%       $      19,992 $ 19,712      $       7,543 $    7,163
200-5%       $      20,159 $ 20,019      $       8,711 $    8,511
200-10%      $      20,905 $ 20,805      $       7,323 $    7,203
200-15%      $      26,412 $ 26,352      $       4,229 $    4,109
19


                    C-Citigroup               CAT-Caterpillar
             Gross Balance Net Balance   Gross Balance Net Balance
Buy and Hold $      14,831 $ 14,811      $      36,474 $ 36,454
5 x 20       $      11,190 $    9,710    $       8,458 $     6,718
20 x 200     $      15,116 $ 14,896      $      24,451 $ 24,171
100-0%       $      10,927 $    9,647    $      16,723 $ 15,463
100-2%       $       9,730 $    9,190    $      27,503 $ 27,053
100-5%       $      12,809 $ 12,549      $      20,114 $ 19,814
100-10%      $      20,982 $ 20,882      $      24,150 $ 24,010
100-15%      $      13,783 $ 13,723      $      14,807 $ 14,707
150-0%       $       8,967 $    7,807    $      15,918 $ 14,718
150-2%       $       8,489 $    8,009    $      20,441 $ 20,021
150-5%       $      10,592 $ 10,352      $      22,797 $ 22,617
150-10%      $      24,915 $ 24,855      $      20,690 $ 20,570
150-15%      $      17,283 $ 17,223      $      12,589 $ 12,469
200-0%       $      11,594 $ 10,334      $      16,054 $ 14,874
200-2%       $      10,026 $    9,566    $      17,586 $ 17,106
200-5%       $      12,499 $ 12,299      $      17,453 $ 17,253
200-10%      $      23,173 $ 23,113      $      15,435 $ 15,315
200-15%      $      15,428 $ 15,368      $      19,217 $ 19,137

                   CVX-Chevron                  DD-Dupont
             Gross Balance Net Balance   Gross Balance Net Balance
Buy and Hold $      32,938 $ 32,918      $       9,737 $    9,717
5 x 20       $      14,911 $ 13,191      $       5,073 $    3,353
20 x 200     $      16,065 $ 15,705      $       4,241 $    3,881
100-0%       $       9,503 $    7,803    $       8,073 $    6,673
100-2%       $      12,866 $ 12,386      $       7,762 $    7,222
100-5%       $      17,158 $ 16,958      $       8,033 $    7,773
100-10%      $      16,970 $ 16,870      $       4,363 $    4,203
100-15%      $      22,692 $ 22,652      $       6,260 $    6,200
150-0%       $      10,959 $    9,539    $       5,324 $    3,984
150-2%       $      15,759 $ 15,299      $       5,475 $    4,955
150-5%       $      15,271 $ 15,071      $       5,103 $    4,843
150-10%      $      23,696 $ 23,636      $       5,179 $    5,059
150-15%      $      16,878 $ 16,818      $       3,374 $    3,274
200-0%       $      10,625 $    8,825    $       3,292 $    1,992
200-2%       $      14,066 $ 13,586      $       4,656 $    4,156
200-5%       $      12,739 $ 12,519      $       4,144 $    3,864
200-10%      $      25,148 $ 25,088      $       4,482 $    4,362
200-15%      $      15,355 $ 15,295      $       3,355 $    3,255
20


                     DIS-Disney             GE-General Electric
             Gross Balance Net Balance   Gross Balance Net Balance
Buy and Hold $      10,548 $ 10,528      $      18,492 $ 18,472
5 x 20       $       2,729 $      949    $       9,671 $     8,031
20 x 200     $      13,363 $ 13,163      $      22,174 $ 21,994
100-0%       $      13,795 $ 12,515      $       9,766 $     8,306
100-2%       $      12,384 $ 11,944      $      13,924 $ 13,584
100-5%       $      14,740 $ 14,480      $      13,392 $ 13,172
100-10%      $       7,949 $    7,769    $      20,424 $ 20,344
100-15%      $       7,540 $    7,440    $      11,419 $ 11,339
150-0%       $      12,565 $ 11,565      $      14,386 $ 13,466
150-2%       $       9,521 $    9,121    $      16,336 $ 16,056
150-5%       $      11,384 $ 11,184      $      21,792 $ 21,672
150-10%      $       7,691 $    7,531    $      21,757 $ 21,677
150-15%      $       7,419 $    7,319    $      18,469 $ 18,409
200-0%       $      10,564 $    9,744    $      15,803 $ 15,103
200-2%       $      12,211 $ 11,971      $      16,730 $ 16,470
200-5%       $      10,604 $ 10,444      $      20,792 $ 20,692
200-10%      $       7,445 $    7,305    $      22,755 $ 22,695
200-15%      $      10,965 $ 10,885      $      27,775 $ 27,735

                GM-General Motors             HD-Home Depot
             Gross Balance Net Balance   Gross Balance Net Balance
Buy and Hold $       7,189 $    7,169    $      14,642 $ 14,622
5 x 20       $      14,377 $ 12,857      $       4,756 $    3,036
20 x 200     $       4,401 $    4,161    $      15,237 $ 14,997
100-0%       $      13,344 $ 12,224      $       6,789 $    5,309
100-2%       $      12,376 $ 11,856      $      10,476 $    9,936
100-5%       $      10,730 $ 10,450      $       8,126 $    7,766
100-10%      $       7,506 $    7,326    $      13,635 $ 13,495
100-15%      $       3,681 $    3,541    $      12,308 $ 12,208
150-0%       $      10,428 $    9,548    $      11,157 $    9,877
150-2%       $      13,896 $ 13,516      $      13,755 $ 13,335
150-5%       $      10,005 $    9,785    $      14,051 $ 13,831
150-10%      $       7,447 $    7,287    $      15,362 $ 15,222
150-15%      $       4,895 $    4,775    $      19,786 $ 19,726
200-0%       $       9,571 $    8,711    $      14,884 $ 14,064
200-2%       $       9,008 $    8,648    $      14,062 $ 13,682
200-5%       $       7,502 $    7,302    $      15,468 $ 15,288
200-10%      $       6,178 $    6,058    $      15,864 $ 15,764
200-15%      $       3,937 $    3,817    $      20,159 $ 20,099
21


               HPQ-Hewlett Packard               IBM-IBM
             Gross Balance Net Balance   Gross Balance Net Balance
Buy and Hold $      22,182 $ 22,162      $      21,442 $ 21,422
5 x 20       $       6,857 $    5,197    $      27,108 $ 25,568
20 x 200     $      28,741 $ 28,601      $       7,759 $    7,439
100-0%       $      20,267 $ 18,947      $       9,635 $    8,275
100-2%       $      26,717 $ 26,257      $       8,170 $    7,630
100-5%       $      29,766 $ 29,546      $       8,634 $    8,294
100-10%      $      30,026 $ 29,886      $      10,001 $    9,861
100-15%      $      17,705 $ 17,585      $       9,750 $    9,630
150-0%       $      26,418 $ 25,678      $      12,576 $ 11,396
150-2%       $      29,837 $ 29,497      $      13,807 $ 13,427
150-5%       $      35,987 $ 35,827      $      12,165 $ 11,925
150-10%      $      35,297 $ 35,197      $      11,995 $ 11,875
150-15%      $      18,146 $ 18,046      $       9,594 $    9,494
200-0%       $      28,995 $ 28,335      $      10,890 $    9,850
200-2%       $      36,049 $ 35,769      $       8,529 $    8,109
200-5%       $      26,027 $ 25,867      $       7,159 $    6,919
200-10%      $      30,721 $ 30,621      $      10,738 $ 10,618
200-15%      $      17,349 $ 17,249      $       8,448 $    8,348

                     INTC-Intel            JNJ-Johnson & Johnson
             Gross Balance Net Balance   Gross Balance Net Balance
Buy and Hold $      15,030 $ 15,010      $      24,029 $ 24,009
5 x 20       $      11,292 $    9,852    $       9,312 $     7,552
20 x 200     $      16,980 $ 16,800      $      15,805 $ 15,605
100-0%       $      13,054 $ 11,454      $       9,535 $     8,075
100-2%       $      11,378 $ 10,738      $      11,012 $ 10,572
100-5%       $      17,490 $ 17,130      $      15,255 $ 15,055
100-10%      $      16,994 $ 16,814      $      11,258 $ 11,158
100-15%      $      11,581 $ 11,441      $      12,558 $ 12,518
150-0%       $      18,618 $ 17,778      $      13,729 $ 12,749
150-2%       $      18,621 $ 18,181      $      14,825 $ 14,525
150-5%       $      17,030 $ 16,770      $      16,144 $ 15,964
150-10%      $      22,879 $ 22,719      $      12,726 $ 12,646
150-15%      $      12,478 $ 12,358      $      12,748 $ 12,708
200-0%       $      13,951 $ 13,291      $      17,959 $ 17,159
200-2%       $      15,167 $ 14,827      $      18,331 $ 18,091
200-5%       $      14,112 $ 13,872      $      13,679 $ 13,519
200-10%      $      21,031 $ 20,911      $      11,873 $ 11,773
200-15%      $      14,900 $ 14,800      $      12,784 $ 12,724
22


                  JPM-JP Morgan                KO-Coca Cola
             Gross Balance Net Balance   Gross Balance Net Balance
Buy and Hold $      15,991 $ 15,971      $      10,933 $ 10,913
5 x 20       $      11,469 $    9,749    $       7,643 $    6,043
20 x 200     $       7,482 $    7,202    $       5,107 $    4,847
100-0%       $       7,286 $    5,766    $       7,075 $    5,755
100-2%       $       6,053 $    5,393    $       9,178 $    8,718
100-5%       $       6,365 $    6,025    $      10,713 $ 10,513
100-10%      $       5,564 $    5,364    $       7,466 $    7,346
100-15%      $       9,899 $    9,799    $       3,965 $    3,865
150-0%       $       5,624 $    4,204    $       7,192 $    6,152
150-2%       $       6,765 $    6,245    $       6,905 $    6,545
150-5%       $       7,514 $    7,254    $       6,729 $    6,509
150-10%      $       6,703 $    6,543    $       7,190 $    7,070
150-15%      $       7,476 $    7,376    $       5,316 $    5,236
200-0%       $       6,119 $    5,019    $       6,324 $    5,324
200-2%       $       6,865 $    6,345    $       6,202 $    5,842
200-5%       $       8,127 $    7,887    $       6,028 $    5,808
200-10%      $       6,769 $    6,629    $       7,021 $    6,901
200-15%      $       8,019 $    7,919    $       4,809 $    4,709

                 MCD-McDonalds                   MMM-3M
             Gross Balance Net Balance   Gross Balance Net Balance
Buy and Hold $      28,189 $ 28,169      $      24,724 $ 24,704
5 x 20       $      12,714 $ 11,174      $      13,189 $ 11,549
20 x 200     $      21,187 $ 20,927      $       8,923 $    8,603
100-0%       $      17,118 $ 15,978      $       6,544 $    5,124
100-2%       $      21,580 $ 21,160      $       6,382 $    5,842
100-5%       $      19,041 $ 18,761      $       5,358 $    5,038
100-10%      $      24,592 $ 24,472      $      11,134 $ 11,034
100-15%      $      50,006 $ 49,966      $      10,631 $ 10,611
150-0%       $      17,651 $ 16,531      $       5,678 $    4,278
150-2%       $      20,233 $ 19,873      $       6,429 $    5,889
150-5%       $      15,257 $ 15,017      $       4,916 $    4,616
150-10%      $      28,375 $ 28,275      $      10,570 $ 10,470
150-15%      $      47,057 $ 47,017      $       8,071 $    8,011
200-0%       $      15,543 $ 14,423      $       7,140 $    5,840
200-2%       $      23,512 $ 23,192      $       6,558 $    6,138
200-5%       $      25,341 $ 25,181      $       6,391 $    6,151
200-10%      $      36,338 $ 36,278      $      12,919 $ 12,839
200-15%      $      41,922 $ 41,882      $      15,043 $ 15,003
23


                   MRK-Merck                  MSFT-Microsoft
             Gross Balance Net Balance   Gross Balance Net Balance
Buy and Hold $      14,900 $ 14,880      $      25,214 $ 25,194
5 x 20       $      12,266 $ 10,806      $      22,452 $ 20,932
20 x 200     $      15,235 $ 15,075      $      11,725 $ 11,425
100-0%       $      12,610 $ 10,990      $       9,379 $    8,019
100-2%       $      12,210 $ 11,670      $      10,275 $    9,715
100-5%       $      13,906 $ 13,646      $       9,470 $    9,130
100-10%      $      16,436 $ 16,316      $      15,631 $ 15,491
100-15%      $      13,259 $ 13,159      $      18,663 $ 18,583
150-0%       $      11,442 $ 10,442      $      15,601 $ 14,381
150-2%       $      13,028 $ 12,708      $      13,367 $ 12,927
150-5%       $      13,791 $ 13,591      $      11,807 $ 11,547
150-10%      $      13,202 $ 13,082      $      15,962 $ 15,842
150-15%      $      13,523 $ 13,443      $      17,240 $ 17,160
200-0%       $      10,544 $    9,544    $      19,514 $ 18,574
200-2%       $      13,235 $ 12,895      $      17,235 $ 16,895
200-5%       $      16,694 $ 16,554      $      18,451 $ 18,271
200-10%      $      14,013 $ 13,913      $      24,382 $ 24,302
200-15%      $      12,628 $ 12,548      $      14,941 $ 14,861

                     PFE-Pfizer            PG-Proctor & Gamble
             Gross Balance Net Balance   Gross Balance Net Balance
Buy and Hold $      11,109 $ 11,089      $      21,628 $ 21,608
5 x 20       $       9,101 $    7,541    $      11,656 $ 10,056
20 x 200     $       7,529 $    7,249    $      14,542 $ 14,322
100-0%       $       5,582 $    4,022    $      18,682 $ 17,302
100-2%       $       7,588 $    7,008    $      21,311 $ 21,011
100-5%       $       6,276 $    5,956    $      17,979 $ 17,799
100-10%      $       6,902 $    6,762    $      11,835 $ 11,735
100-15%      $       4,798 $    4,698    $       7,119 $    7,059
150-0%       $       3,898 $    2,418    $      16,534 $ 15,494
150-2%       $       5,076 $    4,516    $      18,808 $ 18,528
150-5%       $       5,784 $    5,524    $      14,498 $ 14,338
150-10%      $       6,544 $    6,424    $      14,169 $ 14,069
150-15%      $       7,185 $    7,105    $      12,106 $ 12,026
200-0%       $       8,708 $    7,408    $      13,288 $ 12,368
200-2%       $       7,973 $    7,553    $      13,667 $ 13,407
200-5%       $       6,558 $    6,338    $      14,310 $ 14,170
200-10%      $       9,334 $    9,234    $      14,205 $ 14,125
200-15%      $       7,898 $    7,818    $       7,943 $    7,863
24


                      T-AT&T                 UTX-United Tech
             Gross Balance Net Balance   Gross Balance Net Balance
Buy and Hold $      15,720 $ 15,700      $      47,662 $ 47,642
5 x 20       $       6,649 $    4,949    $      20,972 $ 19,472
20 x 200     $      10,128 $    9,888    $      25,657 $ 25,477
100-0%       $       5,437 $    3,777    $      16,901 $ 15,121
100-2%       $       7,133 $    6,553    $      16,924 $ 16,364
100-5%       $       6,162 $    5,822    $      22,342 $ 22,122
100-10%      $      14,311 $ 14,191      $      23,145 $ 23,025
100-15%      $      15,525 $ 15,445      $      13,853 $ 13,753
150-0%       $       7,720 $    6,340    $      16,070 $ 14,530
150-2%       $       7,882 $    7,442    $      18,645 $ 18,225
150-5%       $       8,329 $    8,069    $      27,400 $ 27,200
150-10%      $      14,948 $ 14,848      $      26,250 $ 26,150
150-15%      $      11,654 $ 11,574      $      12,827 $ 12,727
200-0%       $      15,051 $ 14,211      $      19,754 $ 18,914
200-2%       $      14,021 $ 13,741      $      16,974 $ 16,614
200-5%       $       9,370 $    9,150    $      18,938 $ 18,758
200-10%      $      18,891 $ 18,811      $      22,332 $ 22,232
200-15%      $      17,528 $ 17,468      $      10,633 $ 10,533

                    VZ-Verizon                WMT-Wal Mart
             Gross Balance Net Balance   Gross Balance Net Balance
Buy and Hold $      14,282 $ 14,262      $      25,967 $ 25,947
5 x 20       $      12,447 $ 10,947      $       9,500 $    7,800
20 x 200     $       7,817 $    7,597    $      10,552 $ 10,212
100-0%       $       9,239 $    8,059    $       5,399 $    3,879
100-2%       $      10,734 $ 10,314      $       6,204 $    5,544
100-5%       $      10,933 $ 10,693      $       5,382 $    5,042
100-10%      $       6,444 $    6,264    $       8,079 $    7,919
100-15%      $      10,704 $ 10,644      $      19,580 $ 19,540
150-0%       $      11,511 $ 10,591      $       5,338 $    3,818
150-2%       $       7,447 $    7,067    $       5,678 $    5,078
150-5%       $       8,109 $    7,869    $       5,161 $    4,821
150-10%      $      10,452 $ 10,332      $       7,878 $    7,738
150-15%      $      12,248 $ 12,188      $      15,920 $ 15,880
200-0%       $      10,285 $    9,485    $       5,002 $    3,802
200-2%       $       8,812 $    8,492    $       6,775 $    6,215
200-5%       $       7,053 $    6,833    $       7,062 $    6,782
200-10%      $      11,364 $ 11,264      $      11,355 $ 11,235
200-15%      $      12,750 $ 12,690      $      18,031 $ 17,991
25


                    XOM-Exxon
             Gross Balance Net Balance
Buy and Hold $      37,689 $ 37,669
5 x 20       $      15,045 $ 13,425
20 x 200     $      20,201 $ 19,861
100-0%       $      10,415 $    8,475
100-2%       $      17,626 $ 17,186
100-5%       $      13,343 $ 13,083
100-10%      $      24,406 $ 24,346
100-15%      $      17,836 $ 17,796
150-0%       $      11,676 $ 10,236
150-2%       $      15,878 $ 15,418
150-5%       $      12,891 $ 12,671
150-10%      $      25,322 $ 25,262
150-15%      $      16,059 $ 16,019
200-0%       $      13,861 $ 12,581
200-2%       $      15,453 $ 15,033
200-5%       $      15,506 $ 15,326
200-10%      $      25,137 $ 25,077
200-15%      $      18,537 $ 18,497
Simple moving avg

Mais conteúdo relacionado

Semelhante a Simple moving avg

An empirical study of macroeconomic factors and stock market an indian persp...
An empirical study of macroeconomic factors and stock market  an indian persp...An empirical study of macroeconomic factors and stock market  an indian persp...
An empirical study of macroeconomic factors and stock market an indian persp...Saurabh Yadav
 
Nduati Michelle Wanjiku Undergraduate Project
Nduati Michelle Wanjiku Undergraduate ProjectNduati Michelle Wanjiku Undergraduate Project
Nduati Michelle Wanjiku Undergraduate ProjectMichelle Nduati
 
Format to properly write a degree project.docx
Format to properly write a degree project.docxFormat to properly write a degree project.docx
Format to properly write a degree project.docxgreatmike3
 
DL Essay Rubric Levels of Achievement Criteria Out.docx
DL Essay Rubric   Levels of Achievement Criteria Out.docxDL Essay Rubric   Levels of Achievement Criteria Out.docx
DL Essay Rubric Levels of Achievement Criteria Out.docxelinoraudley582231
 
Best Argumentative Essay.pdf
Best Argumentative Essay.pdfBest Argumentative Essay.pdf
Best Argumentative Essay.pdfAlexis Turner
 
Best Argumentative Essay.pdf
Best Argumentative Essay.pdfBest Argumentative Essay.pdf
Best Argumentative Essay.pdfRhonda Ramirez
 
라스토킨유진석사논문(Final 160703)
라스토킨유진석사논문(Final 160703)라스토킨유진석사논문(Final 160703)
라스토킨유진석사논문(Final 160703)Eugene Rastokin
 
indect report Datensammlung in news reports, weblogs, chat
indect report Datensammlung in news reports, weblogs, chatindect report Datensammlung in news reports, weblogs, chat
indect report Datensammlung in news reports, weblogs, chatAlexa Rose
 
Sales and operations planning a research synthesis
Sales and operations planning  a research synthesisSales and operations planning  a research synthesis
Sales and operations planning a research synthesisWallace Almeida
 
Evidence report-35-role-of-career-adaptability
Evidence report-35-role-of-career-adaptabilityEvidence report-35-role-of-career-adaptability
Evidence report-35-role-of-career-adaptabilityDeirdre Hughes
 
Quantitative Assessment of the Individuality of Friction Ridge Patterns.pdf
Quantitative Assessment of the Individuality of Friction Ridge Patterns.pdfQuantitative Assessment of the Individuality of Friction Ridge Patterns.pdf
Quantitative Assessment of the Individuality of Friction Ridge Patterns.pdfElias Mendoza
 
Exit Route Theory Of Globalisation
Exit Route Theory Of GlobalisationExit Route Theory Of Globalisation
Exit Route Theory Of GlobalisationOluwasegun Bewaji
 
Creativity report
Creativity reportCreativity report
Creativity reportgkiyoto
 
Matthew Smith Dissertation
Matthew Smith DissertationMatthew Smith Dissertation
Matthew Smith DissertationMatthew Smith
 
A systematic review_of_internet_banking
A systematic review_of_internet_bankingA systematic review_of_internet_banking
A systematic review_of_internet_bankingsaali5984
 

Semelhante a Simple moving avg (20)

An empirical study of macroeconomic factors and stock market an indian persp...
An empirical study of macroeconomic factors and stock market  an indian persp...An empirical study of macroeconomic factors and stock market  an indian persp...
An empirical study of macroeconomic factors and stock market an indian persp...
 
Nduati Michelle Wanjiku Undergraduate Project
Nduati Michelle Wanjiku Undergraduate ProjectNduati Michelle Wanjiku Undergraduate Project
Nduati Michelle Wanjiku Undergraduate Project
 
okafor2021.pdf
okafor2021.pdfokafor2021.pdf
okafor2021.pdf
 
Format to properly write a degree project.docx
Format to properly write a degree project.docxFormat to properly write a degree project.docx
Format to properly write a degree project.docx
 
DL Essay Rubric Levels of Achievement Criteria Out.docx
DL Essay Rubric   Levels of Achievement Criteria Out.docxDL Essay Rubric   Levels of Achievement Criteria Out.docx
DL Essay Rubric Levels of Achievement Criteria Out.docx
 
NIGERIAN ENERGY RSER
NIGERIAN ENERGY RSERNIGERIAN ENERGY RSER
NIGERIAN ENERGY RSER
 
Z0955523DISS
Z0955523DISSZ0955523DISS
Z0955523DISS
 
Best Argumentative Essay.pdf
Best Argumentative Essay.pdfBest Argumentative Essay.pdf
Best Argumentative Essay.pdf
 
Best Argumentative Essay.pdf
Best Argumentative Essay.pdfBest Argumentative Essay.pdf
Best Argumentative Essay.pdf
 
라스토킨유진석사논문(Final 160703)
라스토킨유진석사논문(Final 160703)라스토킨유진석사논문(Final 160703)
라스토킨유진석사논문(Final 160703)
 
indect report Datensammlung in news reports, weblogs, chat
indect report Datensammlung in news reports, weblogs, chatindect report Datensammlung in news reports, weblogs, chat
indect report Datensammlung in news reports, weblogs, chat
 
MOEX_thesis_FINAL
MOEX_thesis_FINALMOEX_thesis_FINAL
MOEX_thesis_FINAL
 
Sales and operations planning a research synthesis
Sales and operations planning  a research synthesisSales and operations planning  a research synthesis
Sales and operations planning a research synthesis
 
Evidence report-35-role-of-career-adaptability
Evidence report-35-role-of-career-adaptabilityEvidence report-35-role-of-career-adaptability
Evidence report-35-role-of-career-adaptability
 
Full Desso
Full DessoFull Desso
Full Desso
 
Quantitative Assessment of the Individuality of Friction Ridge Patterns.pdf
Quantitative Assessment of the Individuality of Friction Ridge Patterns.pdfQuantitative Assessment of the Individuality of Friction Ridge Patterns.pdf
Quantitative Assessment of the Individuality of Friction Ridge Patterns.pdf
 
Exit Route Theory Of Globalisation
Exit Route Theory Of GlobalisationExit Route Theory Of Globalisation
Exit Route Theory Of Globalisation
 
Creativity report
Creativity reportCreativity report
Creativity report
 
Matthew Smith Dissertation
Matthew Smith DissertationMatthew Smith Dissertation
Matthew Smith Dissertation
 
A systematic review_of_internet_banking
A systematic review_of_internet_bankingA systematic review_of_internet_banking
A systematic review_of_internet_banking
 

Último

Grateful 7 speech thanking everyone that has helped.pdf
Grateful 7 speech thanking everyone that has helped.pdfGrateful 7 speech thanking everyone that has helped.pdf
Grateful 7 speech thanking everyone that has helped.pdfPaul Menig
 
Insurers' journeys to build a mastery in the IoT usage
Insurers' journeys to build a mastery in the IoT usageInsurers' journeys to build a mastery in the IoT usage
Insurers' journeys to build a mastery in the IoT usageMatteo Carbone
 
Call Girls Navi Mumbai Just Call 9907093804 Top Class Call Girl Service Avail...
Call Girls Navi Mumbai Just Call 9907093804 Top Class Call Girl Service Avail...Call Girls Navi Mumbai Just Call 9907093804 Top Class Call Girl Service Avail...
Call Girls Navi Mumbai Just Call 9907093804 Top Class Call Girl Service Avail...Dipal Arora
 
Eni 2024 1Q Results - 24.04.24 business.
Eni 2024 1Q Results - 24.04.24 business.Eni 2024 1Q Results - 24.04.24 business.
Eni 2024 1Q Results - 24.04.24 business.Eni
 
Sales & Marketing Alignment: How to Synergize for Success
Sales & Marketing Alignment: How to Synergize for SuccessSales & Marketing Alignment: How to Synergize for Success
Sales & Marketing Alignment: How to Synergize for SuccessAggregage
 
Mondelez State of Snacking and Future Trends 2023
Mondelez State of Snacking and Future Trends 2023Mondelez State of Snacking and Future Trends 2023
Mondelez State of Snacking and Future Trends 2023Neil Kimberley
 
GD Birla and his contribution in management
GD Birla and his contribution in managementGD Birla and his contribution in management
GD Birla and his contribution in managementchhavia330
 
VIP Kolkata Call Girl Howrah 👉 8250192130 Available With Room
VIP Kolkata Call Girl Howrah 👉 8250192130  Available With RoomVIP Kolkata Call Girl Howrah 👉 8250192130  Available With Room
VIP Kolkata Call Girl Howrah 👉 8250192130 Available With Roomdivyansh0kumar0
 
Yaroslav Rozhankivskyy: Три складові і три передумови максимальної продуктивн...
Yaroslav Rozhankivskyy: Три складові і три передумови максимальної продуктивн...Yaroslav Rozhankivskyy: Три складові і три передумови максимальної продуктивн...
Yaroslav Rozhankivskyy: Три складові і три передумови максимальної продуктивн...Lviv Startup Club
 
Mysore Call Girls 8617370543 WhatsApp Number 24x7 Best Services
Mysore Call Girls 8617370543 WhatsApp Number 24x7 Best ServicesMysore Call Girls 8617370543 WhatsApp Number 24x7 Best Services
Mysore Call Girls 8617370543 WhatsApp Number 24x7 Best ServicesDipal Arora
 
Regression analysis: Simple Linear Regression Multiple Linear Regression
Regression analysis:  Simple Linear Regression Multiple Linear RegressionRegression analysis:  Simple Linear Regression Multiple Linear Regression
Regression analysis: Simple Linear Regression Multiple Linear RegressionRavindra Nath Shukla
 
VIP Call Girls In Saharaganj ( Lucknow ) 🔝 8923113531 🔝 Cash Payment (COD) 👒
VIP Call Girls In Saharaganj ( Lucknow  ) 🔝 8923113531 🔝  Cash Payment (COD) 👒VIP Call Girls In Saharaganj ( Lucknow  ) 🔝 8923113531 🔝  Cash Payment (COD) 👒
VIP Call Girls In Saharaganj ( Lucknow ) 🔝 8923113531 🔝 Cash Payment (COD) 👒anilsa9823
 
Monthly Social Media Update April 2024 pptx.pptx
Monthly Social Media Update April 2024 pptx.pptxMonthly Social Media Update April 2024 pptx.pptx
Monthly Social Media Update April 2024 pptx.pptxAndy Lambert
 
Creating Low-Code Loan Applications using the Trisotech Mortgage Feature Set
Creating Low-Code Loan Applications using the Trisotech Mortgage Feature SetCreating Low-Code Loan Applications using the Trisotech Mortgage Feature Set
Creating Low-Code Loan Applications using the Trisotech Mortgage Feature SetDenis Gagné
 
Progress Report - Oracle Database Analyst Summit
Progress  Report - Oracle Database Analyst SummitProgress  Report - Oracle Database Analyst Summit
Progress Report - Oracle Database Analyst SummitHolger Mueller
 
BEST ✨ Call Girls In Indirapuram Ghaziabad ✔️ 9871031762 ✔️ Escorts Service...
BEST ✨ Call Girls In  Indirapuram Ghaziabad  ✔️ 9871031762 ✔️ Escorts Service...BEST ✨ Call Girls In  Indirapuram Ghaziabad  ✔️ 9871031762 ✔️ Escorts Service...
BEST ✨ Call Girls In Indirapuram Ghaziabad ✔️ 9871031762 ✔️ Escorts Service...noida100girls
 
RE Capital's Visionary Leadership under Newman Leech
RE Capital's Visionary Leadership under Newman LeechRE Capital's Visionary Leadership under Newman Leech
RE Capital's Visionary Leadership under Newman LeechNewman George Leech
 
7.pdf This presentation captures many uses and the significance of the number...
7.pdf This presentation captures many uses and the significance of the number...7.pdf This presentation captures many uses and the significance of the number...
7.pdf This presentation captures many uses and the significance of the number...Paul Menig
 
Call Girls Pune Just Call 9907093804 Top Class Call Girl Service Available
Call Girls Pune Just Call 9907093804 Top Class Call Girl Service AvailableCall Girls Pune Just Call 9907093804 Top Class Call Girl Service Available
Call Girls Pune Just Call 9907093804 Top Class Call Girl Service AvailableDipal Arora
 

Último (20)

Grateful 7 speech thanking everyone that has helped.pdf
Grateful 7 speech thanking everyone that has helped.pdfGrateful 7 speech thanking everyone that has helped.pdf
Grateful 7 speech thanking everyone that has helped.pdf
 
Insurers' journeys to build a mastery in the IoT usage
Insurers' journeys to build a mastery in the IoT usageInsurers' journeys to build a mastery in the IoT usage
Insurers' journeys to build a mastery in the IoT usage
 
Call Girls Navi Mumbai Just Call 9907093804 Top Class Call Girl Service Avail...
Call Girls Navi Mumbai Just Call 9907093804 Top Class Call Girl Service Avail...Call Girls Navi Mumbai Just Call 9907093804 Top Class Call Girl Service Avail...
Call Girls Navi Mumbai Just Call 9907093804 Top Class Call Girl Service Avail...
 
Eni 2024 1Q Results - 24.04.24 business.
Eni 2024 1Q Results - 24.04.24 business.Eni 2024 1Q Results - 24.04.24 business.
Eni 2024 1Q Results - 24.04.24 business.
 
Sales & Marketing Alignment: How to Synergize for Success
Sales & Marketing Alignment: How to Synergize for SuccessSales & Marketing Alignment: How to Synergize for Success
Sales & Marketing Alignment: How to Synergize for Success
 
Mondelez State of Snacking and Future Trends 2023
Mondelez State of Snacking and Future Trends 2023Mondelez State of Snacking and Future Trends 2023
Mondelez State of Snacking and Future Trends 2023
 
GD Birla and his contribution in management
GD Birla and his contribution in managementGD Birla and his contribution in management
GD Birla and his contribution in management
 
VIP Kolkata Call Girl Howrah 👉 8250192130 Available With Room
VIP Kolkata Call Girl Howrah 👉 8250192130  Available With RoomVIP Kolkata Call Girl Howrah 👉 8250192130  Available With Room
VIP Kolkata Call Girl Howrah 👉 8250192130 Available With Room
 
Yaroslav Rozhankivskyy: Три складові і три передумови максимальної продуктивн...
Yaroslav Rozhankivskyy: Три складові і три передумови максимальної продуктивн...Yaroslav Rozhankivskyy: Три складові і три передумови максимальної продуктивн...
Yaroslav Rozhankivskyy: Три складові і три передумови максимальної продуктивн...
 
Mysore Call Girls 8617370543 WhatsApp Number 24x7 Best Services
Mysore Call Girls 8617370543 WhatsApp Number 24x7 Best ServicesMysore Call Girls 8617370543 WhatsApp Number 24x7 Best Services
Mysore Call Girls 8617370543 WhatsApp Number 24x7 Best Services
 
Regression analysis: Simple Linear Regression Multiple Linear Regression
Regression analysis:  Simple Linear Regression Multiple Linear RegressionRegression analysis:  Simple Linear Regression Multiple Linear Regression
Regression analysis: Simple Linear Regression Multiple Linear Regression
 
Nepali Escort Girl Kakori \ 9548273370 Indian Call Girls Service Lucknow ₹,9517
Nepali Escort Girl Kakori \ 9548273370 Indian Call Girls Service Lucknow ₹,9517Nepali Escort Girl Kakori \ 9548273370 Indian Call Girls Service Lucknow ₹,9517
Nepali Escort Girl Kakori \ 9548273370 Indian Call Girls Service Lucknow ₹,9517
 
VIP Call Girls In Saharaganj ( Lucknow ) 🔝 8923113531 🔝 Cash Payment (COD) 👒
VIP Call Girls In Saharaganj ( Lucknow  ) 🔝 8923113531 🔝  Cash Payment (COD) 👒VIP Call Girls In Saharaganj ( Lucknow  ) 🔝 8923113531 🔝  Cash Payment (COD) 👒
VIP Call Girls In Saharaganj ( Lucknow ) 🔝 8923113531 🔝 Cash Payment (COD) 👒
 
Monthly Social Media Update April 2024 pptx.pptx
Monthly Social Media Update April 2024 pptx.pptxMonthly Social Media Update April 2024 pptx.pptx
Monthly Social Media Update April 2024 pptx.pptx
 
Creating Low-Code Loan Applications using the Trisotech Mortgage Feature Set
Creating Low-Code Loan Applications using the Trisotech Mortgage Feature SetCreating Low-Code Loan Applications using the Trisotech Mortgage Feature Set
Creating Low-Code Loan Applications using the Trisotech Mortgage Feature Set
 
Progress Report - Oracle Database Analyst Summit
Progress  Report - Oracle Database Analyst SummitProgress  Report - Oracle Database Analyst Summit
Progress Report - Oracle Database Analyst Summit
 
BEST ✨ Call Girls In Indirapuram Ghaziabad ✔️ 9871031762 ✔️ Escorts Service...
BEST ✨ Call Girls In  Indirapuram Ghaziabad  ✔️ 9871031762 ✔️ Escorts Service...BEST ✨ Call Girls In  Indirapuram Ghaziabad  ✔️ 9871031762 ✔️ Escorts Service...
BEST ✨ Call Girls In Indirapuram Ghaziabad ✔️ 9871031762 ✔️ Escorts Service...
 
RE Capital's Visionary Leadership under Newman Leech
RE Capital's Visionary Leadership under Newman LeechRE Capital's Visionary Leadership under Newman Leech
RE Capital's Visionary Leadership under Newman Leech
 
7.pdf This presentation captures many uses and the significance of the number...
7.pdf This presentation captures many uses and the significance of the number...7.pdf This presentation captures many uses and the significance of the number...
7.pdf This presentation captures many uses and the significance of the number...
 
Call Girls Pune Just Call 9907093804 Top Class Call Girl Service Available
Call Girls Pune Just Call 9907093804 Top Class Call Girl Service AvailableCall Girls Pune Just Call 9907093804 Top Class Call Girl Service Available
Call Girls Pune Just Call 9907093804 Top Class Call Girl Service Available
 

Simple moving avg

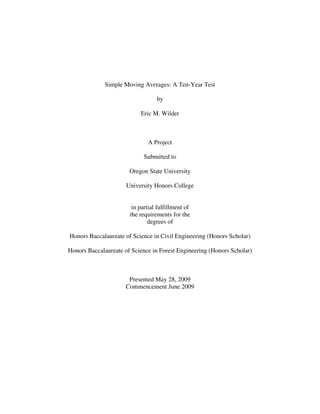
  • 1. Simple Moving Averages: A Ten-Year Test by Eric M. Wilder A Project Submitted to Oregon State University University Honors College in partial fulfillment of the requirements for the degrees of Honors Baccalaureate of Science in Civil Engineering (Honors Scholar) Honors Baccalaureate of Science in Forest Engineering (Honors Scholar) Presented May 28, 2009 Commencement June 2009
  • 2.
  • 3. AN ABSTRACT OF THE THESIS OF Eric M. Wilder for the degrees of Honors Baccalaureate of Science in Civil Engineering and Honors Baccalaureate of Science in Forest Engineering presented on May 28, 2009. Title: Simple Moving Averages and the Stock Market Abstract Approved: Jimmy Yang The intent of this thesis is to prove whether or not simple moving averages can be used to predict the future price performance of stocks and outperform the buy-and-hold method of investing in the stock market. The importance of this research is that if moving averages can predict future price performance then they could be used as a way to gain an advantage when investing in the stock market. Historical prices for 29 of the 30 stocks currently in the Dow Jones Industrial Average were used to empirically test a variety of moving average criteria to buy and sell stocks to see if the buy-and-hold method could be outperformed. It was found that the moving averages tested could not compete with the buy- and-hold method and that historical price movements could not predict future performance. The results in this thesis provided further evidence for the Efficient Market Hypothesis and the Random Walk Hypothesis and demonstrated that moving averages may not be a valid and successful way to invest in the stock market. Key Words: Stock Market, Efficient Market, Random Walk, Moving Average, Technical Analysis Corresponding e-mail address: wildere@onid.orst.edu
  • 4. ©Copyright by Eric M. Wilder May 28, 2009 All Rights Reserved
  • 5. Simple Moving Averages: A Ten-Year Test by Eric M. Wilder A Project Submitted to Oregon State University University Honors College in partial fulfillment of the requirements for the degrees of Honors Baccalaureate of Science in Civil Engineering (Honors Scholar) Honors Baccalaureate of Science in Forest Engineering (Honors Scholar) Presented May 28, 2009 Commencement June 2009
  • 6. Honors Baccalaureate of Science in Civil Engineering and Honors Baccalaureate of Science in Forest Engineering project of Eric M. Wilder presented on May 28, 2009. APPROVED: Mentor, representing Finance Committee Member, representing Civil and Construction Engineering Committee Member, representing Finance Dean, University Honors College I understand that my project will become part of the permanent collection of Oregon State University, University Honors College. My signature below authorizes release of my project to any reader upon request. Eric M. Wilder, Author
  • 7. Table of Contents Page Section I Introduction..........................................................................................................................1 Past Study.............................................................................................................................1 Section II Literature Review .................................................................................................................3 Technical Analysis vs. Fundamental Analysis .....................................................................4 Random Walk vs. Efficient Market.......................................................................................4 Section III Importance ...........................................................................................................................6 Section IV Methodology ........................................................................................................................8 Section V Results ................................................................................................................................13 Conclusion .........................................................................................................................15 Appendix Final Balances per Stock ...................................................................................................18
  • 8. List of Figures Figure Page 3.1 Sample Moving Average Chart ............................................................................................6 5.1 Combined Final Balances Compared to Buy-and-Hold ....................................................14
  • 9. List of Tables Table Page 4.1 The 30 Stocks of the Dow Jones ...........................................................................................9 4.2 Sample Moving Average Calculations ...............................................................................10 4.3 Average Number of Trades per Year .................................................................................10 4.4 Combined Final Balances with $1,000 Initial Investments ...............................................12 5.1 Combined Final Balances with $10,000 Initial Investments .............................................14
  • 10. Simple Moving Averages: A Ten-Year Test Section I Introduction This thesis was written with the intention of discovering if using certain basic technical analysis methods for investing in the stock market can yield higher returns, on average, than a simple buy-and-hold strategy. The type of technical analysis used was the crossing of moving averages; this method of investing was empirically tested with historical prices. Moving averages are a type of technical analysis that have been used to analyze trends in the stock market and signify when a stock should be bought or sold. A moving average is the average price of a stock over a specified duration, typically 5, 20, 100, 150 or 200-days. It is commonly believed among technical analysts that this method will yield higher returns and help reduce losses when investing in the stock market. The research completed for this thesis was used to explore the validity of this claim. Two types of moving average methods were used; first was the crossing of two moving averages and second was the crossing of a moving average with the price of the particular stock, with a given threshold. Similar Past Study In 1967, an article was written by Van Horne and Parker called “The Random-Walk Theory: An Empirical Test,” in which a study was conducted to see if there was a correlation between past price movements and future prices of stocks. A simulated $10,000 was invested in
  • 11. 2 each of the thirty chosen stocks and they were analyzed from October 17, 1960 to June 30, 1966. The 30 stocks were chosen at random with no selection criteria. In this article stocks were bought and sold based on the price crossing three different moving averages, 200 days, 150 days, and 100 days. Five different thresholds were used for each of the three moving averages; 0, 2, 5, 10, and 15%. For example, this would mean that for a 200-day moving average and a ten percent threshold, the stock price must move ten percent above the 200-day moving average before it was bought. There are two main reasons for using thresholds, the first is to help minimize risk and the second is the higher the threshold the less trades that need to be made (Van Horne and Parker 1967). It was found by Van Horne and Parker that the buy-and-hold strategy yielded better returns than any of the moving average and threshold combinations. The basis of this thesis was to conduct a similar study using the methodology listed above with more recent stocks and prices to see if past price behavior has more of a correlation with future prices than it did in the 1960’s.
  • 12. 3 Section II Literature Review Haug and Hirschey (2006) researched a trend known as the January effect. In their article they presented evidence that during the month of January the average return in the stock market was nearly 3.5 percent and returned only 0.42 percent per month during the rest of the year from 1904 to 1974. Their overall conclusion was this: “A January effect in equal-weighted returns remains today that is both statistically significant and economically meaningful.” Although this does not bear any direct meaning for technical analysis it does shed light on whether or not patterns do exist in the stock market and whether they can be used to make a profit (Haug and Hirschey 2006). Fama’s (1965) article, titled Random Walks in Stock Market Prices, discusses how random walks affect technical analysis and what must be done by analysts to prove that technical analysis actually works. “The empirical evidence to date provides strong support for the random walk model. In this light the only way the chartist can vindicate his position is to show that he can consistently use his techniques to make better than chance predictions of stock prices. It is not enough for him to talk mystically about patterns that he sees in the data. He must show that he can consistently use these patterns to make meaningful predictions of future prices (Fama 1965).” This gets at the essence behind the research done in this thesis, to see if the patterns do exist and if they can lead to higher returns. For technical analysis to hold any weight as an investment strategy it must be proven that it can actually yield higher profits than just buying and holding a stock. By completing an empirical study of past price movements and their correlation
  • 13. 4 to future prices it should become clear whether a correlation exists between past and future prices of stocks. Technical Analysis vs. Fundamental Analysis This study focused solely on technical analysis for trading rules. Technical analysis is the use of past price history or trends to predict future price performance. Moving averages are just one of the many ways that can be used to indicate the beginning or ending of a trend in price movement. Technical analysis differs from fundamental analysis in that fundamental analysis uses information about a particular stock to analyze earnings and attempt to predict future performance based on information about past and estimated future fundamentals of stocks. Random Walk vs. Efficient Market The Random Walk Hypothesis states that the market cannot be predicted based on past performance and that price changes are purely random. The definition of the Random Walk Hypothesis and how it relates to technical analysis is as follows: “The basic random walk theory constitutes a refutation of technical analysis and simply states that successive stock price changes are statistically independent, and that historical stock price movements will, therefore, convey no information concerning future stock price movements (Jones 1973).” The Efficient Market Hypothesis is correlated to the Random Walk Hypothesis and is based on the belief that stock prices fully reflect all known information. This means that any information that an investor believes can be used to turn a profit is essentially useless, because this information is already fully reflected in the price of the stock (Fama 1991). The investigation
  • 14. 5 of moving averages is an inquiry of both the Efficient Market Hypothesis and the Random Walk Hypothesis in trying to prove that stock prices are not random and can be predicted based on past price movements. Technical analysts typically do not believe in the Random Walk Hypothesis because they believe prices can be used as buy and sell indicators and that price movements are not random. Using basic technical analysis to empirically test stocks and see if the price movements could have been predicted, will either build more evidence that the Efficient Market Hypothesis and the Random Walk Hypothesis may hold true, or indicate that future stock prices can be predicted using historical price movements. If this is true, then moving averages can be used to yield higher returns than buy-and-hold.
  • 15. 6 Section III Importance The importance of this study is to find out if moving averages are a better method for investing in the stock market, than a simple buy-and-hold strategy. One reason for looking at this particular method of technical analysis is that it is easy for any level of investor to incorporate simple moving averages in their trading criteria. Moving average charts can be found for free on many financial websites, such as Yahoo Finance or MSN Money. An example of a price history chart with moving averages can be seen in Figure 3.1. When the 5-day moving average crosses above the 20-day moving average that is a buy signal, and the sell signal is indicated when the 5-day moving average crosses below the 20-day moving average. This rule is based on the belief that the stock price is gaining momentum when the 5-day average crosses above the 20-day average and the stock price is losing momentum when the 20-day average crosses above the 5-day average. Buy Sell Buy Sell Figure 3.1: Sample Moving Average Chart
  • 16. 7 Figure 3.1 demonstrates how thresholds can help reduce risk when using moving averages. Without a threshold the first buy would have led to a purchase of the stock for about $48 per share and then sold for about $46 per share. This would have been a loss of $2 per share. The first buy would have been prevented if a threshold was imposed and the 5-day moving average was required to move at least 2% above the 20-day moving average. The stock would have then only been purchased on the second buy signal for about $44 per share. By empirically testing these methods of investing it will become more apparent if technical analysis works and if investors should use moving averages as investment strategies. If the trading criteria tested do not yield higher returns and the buy-and-hold method yields better results, then it will be clear that investors should use the buy-and-hold strategy rather than technical analysis when investing in the stock market and that the Efficient Market Hypothesis and the Random Walk Hypothesis may be true.
  • 17. 8 Section IV Methodology The methodology used in this thesis was done with the intention to conduct a similar study to that of Van Horne and Parker (1967), with more contemporary stocks and prices, to see if past price behavior has more of a correlation with future prices than it did in the 1960’s. The initial plan was to invest $10,000 in each of the 30 stocks in the Dow Jones Industrial Average from January 2, 1998 to January 2, 2008. The reason for choosing stocks contained in the Dow Jones was to try and get a sample of stocks representative of what the average investor is likely to invest in and have some familiarity with. Since Kraft Foods Inc. has only been publicly traded since 2001; it did not meet the desired ten-year study period, so its price history data was not used in this study. Each of the other 29 stocks that were studied were all traded based on 18 different criteria, buy-and-hold, the crossing of 20-day and 5-day moving averages, the crossing of 200-day and 20-day moving averages, and the stock price crossing the 100, 150, and 200-day moving averages with 0, 2, 5, 10, and 15% thresholds. The 18 different criteria applied to 29 stocks for a total of 522 different tests. The buy-and-hold strategy simulates the use of $10,000 to buy as many shares as possible for each stock on January 2, 1998 and holds for the entire ten- year study period and sells on the final day, January 2, 2008. The 30 stocks of the Dow Jones can be found in Table 4.1 below:
  • 18. 9 Table 4.1: The 30 Stocks of the Dow Jones Symbol-Name Symbol-Name Symbol-Name AA-Alcoa GM-General Motors MMM-3M AXP-American Express HD-Home Depot MRK-Merck BA-Boeing HPQ-Hewlett Packard MSFT-Microsoft BAC-Bank of America IBM-IBM PFE-Pfizer C-Citigroup INTC-Intel PG-Proctor & Gamble CAT-Caterpillar JNJ-Johnson & Johnson T-AT&T CVX-Chevron JPM-JP Morgan UTX-United Tech DD-Du Pont KFT-Kraft* VZ-Verizon DIS-Disney KO-Coca Cola WMT-Wal-Mart GE-General Electric MCD-McDonalds XOM-Exxon *Not used in study To incorporate splits and dividends over the ten year study period, the adjusted closing price of the stocks were used for the analysis. Each stock was bought and sold based on the criteria listed above, if a stock was still held when the study period ended on January 2, 2008, the stock was sold at the adjusted closing price on that day. The price history used in the analysis for all 29 stocks was downloaded from the Yahoo! Finance website. If the stock was to be bought or sold it would be done at the closing price of the day after the moving averages crossed. The closing price is not always the ideal price to use for analysis, as the closing price has a tendency to be either the high or the low stock price for the day (Boldt and Arbit 1984). In this instance the closing prices were the only price history data that was available as an adjusted price for splits and dividends. It is believed that since so many stocks were analyzed, the bias presented by only using the closing prices would average out to a good representation of the stock price. Once all of the historical prices were collected and reduced down to the required timeframe, I calculated all of the required moving averages for each stock using the adjusted closing prices. For example, a 5-day moving average for a particular day would be calculated by averaging that day’s closing price and the previous four day’s closing price. In Table 4.2 below example formulas for calculating moving averages in Excel can be found:
  • 19. 10 Table 4.2: Sample Moving Average Calculations Day Price 5-Day MA 1 $ 30.56 - 2 $ 31.02 - 3 $ 33.65 - 4 $ 32.87 - 5 $ 31.54 =AVERAGE(Day 1:Day 5) 6 $ 30.99 =AVERAGE(Day 2:Day 6) 7 $ 29.87 =AVERAGE(Day 3:Day 7) 8 $ 29.66 =AVERAGE(Day 4:Day 8) 9 $ 30.44 =AVERAGE(Day 5:Day 9) 10 $ 28.74 =AVERAGE(Day 6:Day 10) Transaction fees were included and assumed to be ten dollars per trade. In Table 5.1, in the results section, the final balance with transaction fees and the final balance without transaction fees can be found. The inclusion of transaction fees had no major effect on the final results; the reason is that before the fees were included, the buy-and-hold method yielded the highest closing balance, while utilizing the fewest trades. The average number of trades per year for each trading rule can be found in the Table 4.3 below: Table 4.3: Average Number of Trades per Year Rule Trades/yr Rule Trades/yr Rule Trades/yr Buy & Hold 0.2 100-10% 1.3 150-15% 0.8 5 x 20 16.2 100-15% 0.8 200-0% 10.2 20 x 200 2.5 150-0% 11.7 200-2% 3.8 100-0% 14.4 150-2% 4.2 200-5% 2.0 100-2% 5.1 150-5% 2.2 200-10% 1.0 100-5% 2.7 150-10% 1.1 200-15% 0.8 In the Table 4.3 the nomenclature is as follows, “5 x 20” is the 5-day moving average crossing the 20-day moving average and the “100-0%” is the 100-day moving average crossing the stock price with a 0% threshold. Including the trading fees did not change any of the results of this study, but could have had a significant effect if less money were to be invested in each of the 29 stocks. For example, if $1,000 were invested initially in each stock, instead of $10,000,
  • 20. 11 then the moving averages would yield even less money than they did, because the trading fees would have a much more significant impact on the final net balance. The result of only investing $1,000 in each stock initially are shown below in Table 4.4. In this case, the transaction fees were subtracted off the final balances for each stock, so in some instances the fees were actually greater than the final balance. This resulted in negative final balances for two of the trading criteria, the 5-day crossed with the 20-day moving average and the 100-day moving average with no threshold. It is not possible to have a negative final balance, because in a real trading account the fees would be taken out as the trades occurred and the account balance would eventually just go to zero. The $1,000 investments were not initially part of this study and it was not anticipated that the transaction fees would have such an adverse effect on the final balances of each stock; otherwise the fees would have been incorporated as each trade was made. The significance would be that transaction fees have the potential to be a major downfall of technical analysis, especially if the principal invested is not great enough to warrant so many transactions, particularly in the case of trading criteria that require frequent trades. An example of this is the 5-day moving average crossed with the 20-day moving average trading criteria. This method averaged 16 trades per year, which is an average cost of $160 per year in trading fees, with only a $1,000 initial investment that is a large percentage of the investment lost just because of transaction fees
  • 21. 12 Table 4.4: Combined Final Balances with $1,000 Initial Investments Gross Balance Net Balance Buy-and-Hold $ 60,433.69 $ 59,853.69 5 x 20 $ 33,108.43 $ (13,891.57) 20 x 200 $ 40,659.57 $ 33,419.57 100-0% $ 31,616.83 $ (10,083.17) 100-2% $ 36,034.72 $ 21,184.72 100-5% $ 38,754.93 $ 30,894.93 100-10% $ 41,303.45 $ 37,403.45 100-15% $ 39,473.04 $ 37,093.04 150-0% $ 34,313.26 $ 393.26 150-2% $ 37,254.07 $ 24,934.07 150-5% $ 38,579.12 $ 32,059.12 150-10% $ 44,888.17 $ 41,588.17 150-15% $ 39,662.93 $ 37,342.93 200-0% $ 36,421.69 $ 6,701.69 200-2% $ 38,528.80 $ 27,528.80 200-5% $ 37,446.45 $ 31,746.45 200-10% $ 46,807.39 $ 43,947.39 200-15% $ 41,714.99 $ 39,514.99
  • 22. 13 Section V Results The results of this study are consistent with those from Van Horne and Parker (1967), in which no technical trading method yielded higher results than the buy-and-hold method. This is also consistent with the Random Walk Hypothesis and the Efficient Market Hypothesis, where it appears that future price performance cannot be predicted based on historical price movements alone. In Table 5.1 below the results for the total value of each trading technique can be seen: Table 5.1: Combined Final Balances with $10,000 Initial Investments Gross Balance Net Balance Buy-and-Hold $ 607,723.61 $ 607,143.61 5 x 20 $ 331,447.35 $ 284,447.35 20 x 200 $ 407,250.07 $ 400,010.07 100-0% $ 315,570.22 $ 273,870.22 100-2% $ 360,469.33 $ 345,619.33 100-5% $ 387,675.62 $ 379,815.62 100-10% $ 414,034.21 $ 410,134.21 100-15% $ 394,338.68 $ 391,958.68 150-0% $ 342,789.25 $ 308,869.25 150-2% $ 372,058.41 $ 359,738.41 150-5% $ 386,031.88 $ 379,511.88 150-10% $ 449,651.92 $ 446,351.92 150-15% $ 397,370.03 $ 395,050.03 200-0% $ 364,210.36 $ 334,490.36 200-2% $ 385,641.13 $ 374,641.13 200-5% $ 374,641.02 $ 368,941.02 200-10% $ 469,288.11 $ 466,428.11 200-15% $ 417,441.36 $ 415,241.36 Using the buy-and-hold strategy a final gross balance of $607,723.61 was accumulated, this is equivalent to an annual compounded rate of return of 7.1%. The highest gross balance accumulated by any one of the technical trading rules was using the 200-day moving average with a ten percent threshold and this method accumulated $469,288.11, nearly $130,000 less
  • 23. 14 than the buy-and-hold over the span of ten years, this is equivalent to a rate of return of 3.4%. This result is important because it is now clearer that moving averages cannot be used to predict future price movements and that price movements may indeed be a random walk. Including transaction fees, the net balances for these methods were $607,143.61 and $466,428.11, respectively. In Figure 5.1, the net balance for each trading rule are plotted in a column chart with the buy-and-hold balance plotted as a line across the top to compare just how close the technical trading rules were to competing with the buy-and-hold method. Something noteworthy can be seen on this figure, the trend that the final balances of the trading rules with thresholds follow. They tend to peak at the moving averages used with a ten percent threshold. This means that if moving averages are to be used they should be used with a ten percent threshold. This compares with the results from Van Horne and Parker (1967) in that their findings had the highest returns for all moving averages with 10% thresholds. Net Balance $700,000.00 Buy and Hold = $607,143.61 $600,000.00 $500,000.00 100-day 150-day 200-day Final Balance $400,000.00 $300,000.00 $200,000.00 $100,000.00 $- Trading Criteria Figure 5.1: Combined Final Balances Compared to Buy-and-Hold
  • 24. 15 Conclusion The results from this empirical research support the Random Walk Hypothesis and the Efficient Market Hypothesis, in that the stock prices in this study could not be predicted based on past performance and it is more lucrative to use the buy-and-hold method over technical trading rules. Another significance is that technical trading rules and programs seen on television that advertise surefire methods for investing in the stock market may not be as lucrative as they are portrayed to be. The most important thing to be taken away from the finding in this study is that amateur investors should stick to a simple buy-and-hold method for investing their money in the stock market. If moving averages are to be used by investors, then based on this study and the results from Van Horne and Parker (1967), investors who do not use the buy-and-hold method and are using moving averages, should use a 200-day moving average with a ten percent threshold. One limitation of this study was the lack of investing opportunities for the cash that is held when not invested in the market. The reason for not assuming an investment opportunity for cash was that the margin of difference between the balances of the buy-and-hold method and any of the technical trading rules was so great that the cash investments would have made no significant difference in the final results. Another limitation of this study is that the Dow Jones Industrial Average contains highly traded large cap stocks and the results from this study may have been drastically different for stocks with different market capitalizations.
  • 25. 16 Bibliography Boldt, Bob L., Hal L. Arbit. "Efficient Markets and the Professional Investor." Financial Analysts Journal July-August (1984): 22-34. Fama, Eugene F. "Efficient Capital Markets II." The Journal of Finance XLVI(1991): 1575- 1617 Fama, Eugene F. "Random Walks in Stock Market Prices." Financial Analysts Journal September-October (1965): 55-59. Haug, Mark, Mark Hirschey. "The January Effect." Financial Analysts Journal September- October (2006): 68-88. Jones, Charles P. "Earnings Trends and Investment Selection." Financial Analysts Journal March-April (1973): 79-85. Van Horne, James C., George G. C. Parker. "The Random-Walk Theory: An Empirical Test." Financial Analysts Journal November-December (1967): 87-92.
  • 26. 17 Appendix Final Balances per Stock
  • 27. 18 AA-Alcoa AXP-American Express Gross Balance Net Balance Gross Balance Net Balance Buy and Hold $ 24,470 $ 24,450 $ 21,520 $ 21,500 5 x 20 $ 4,785 $ 3,205 $ 8,652 $ 6,752 20 x 200 $ 17,131 $ 16,891 $ 13,231 $ 12,971 100-0% $ 9,929 $ 8,329 $ 8,062 $ 6,422 100-2% $ 8,809 $ 8,109 $ 10,792 $ 10,272 100-5% $ 13,455 $ 13,155 $ 17,216 $ 16,996 100-10% $ 17,338 $ 17,198 $ 15,887 $ 15,767 100-15% $ 18,813 $ 18,733 $ 11,236 $ 11,136 150-0% $ 10,294 $ 9,134 $ 8,045 $ 6,645 150-2% $ 12,323 $ 11,863 $ 9,019 $ 8,499 150-5% $ 14,315 $ 14,075 $ 17,708 $ 17,528 150-10% $ 15,570 $ 15,450 $ 12,974 $ 12,874 150-15% $ 17,738 $ 17,658 $ 9,536 $ 9,436 200-0% $ 12,063 $ 10,923 $ 7,316 $ 5,916 200-2% $ 14,989 $ 14,489 $ 9,413 $ 8,933 200-5% $ 11,553 $ 11,333 $ 12,215 $ 12,035 200-10% $ 18,901 $ 18,801 $ 13,256 $ 13,156 200-15% $ 15,141 $ 15,061 $ 11,308 $ 11,228 BA-Boeing BAC-Bank of America Gross Balance Net Balance Gross Balance Net Balance Buy and Hold $ 20,605 $ 20,585 $ 19,589 $ 19,569 5 x 20 $ 17,222 $ 15,842 $ 9,948 $ 8,188 20 x 200 $ 16,653 $ 16,473 $ 9,814 $ 9,574 100-0% $ 13,756 $ 12,596 $ 10,748 $ 9,568 100-2% $ 13,968 $ 13,468 $ 9,407 $ 8,927 100-5% $ 23,762 $ 23,562 $ 9,725 $ 9,485 100-10% $ 13,421 $ 13,241 $ 7,188 $ 7,048 100-15% $ 18,138 $ 18,038 $ 6,231 $ 6,151 150-0% $ 20,056 $ 19,156 $ 7,411 $ 6,411 150-2% $ 16,770 $ 16,410 $ 7,045 $ 6,565 150-5% $ 13,296 $ 13,096 $ 6,204 $ 5,944 150-10% $ 15,495 $ 15,355 $ 8,413 $ 8,293 150-15% $ 23,963 $ 23,883 $ 5,791 $ 5,691 200-0% $ 21,231 $ 20,631 $ 8,283 $ 7,243 200-2% $ 19,992 $ 19,712 $ 7,543 $ 7,163 200-5% $ 20,159 $ 20,019 $ 8,711 $ 8,511 200-10% $ 20,905 $ 20,805 $ 7,323 $ 7,203 200-15% $ 26,412 $ 26,352 $ 4,229 $ 4,109
  • 28. 19 C-Citigroup CAT-Caterpillar Gross Balance Net Balance Gross Balance Net Balance Buy and Hold $ 14,831 $ 14,811 $ 36,474 $ 36,454 5 x 20 $ 11,190 $ 9,710 $ 8,458 $ 6,718 20 x 200 $ 15,116 $ 14,896 $ 24,451 $ 24,171 100-0% $ 10,927 $ 9,647 $ 16,723 $ 15,463 100-2% $ 9,730 $ 9,190 $ 27,503 $ 27,053 100-5% $ 12,809 $ 12,549 $ 20,114 $ 19,814 100-10% $ 20,982 $ 20,882 $ 24,150 $ 24,010 100-15% $ 13,783 $ 13,723 $ 14,807 $ 14,707 150-0% $ 8,967 $ 7,807 $ 15,918 $ 14,718 150-2% $ 8,489 $ 8,009 $ 20,441 $ 20,021 150-5% $ 10,592 $ 10,352 $ 22,797 $ 22,617 150-10% $ 24,915 $ 24,855 $ 20,690 $ 20,570 150-15% $ 17,283 $ 17,223 $ 12,589 $ 12,469 200-0% $ 11,594 $ 10,334 $ 16,054 $ 14,874 200-2% $ 10,026 $ 9,566 $ 17,586 $ 17,106 200-5% $ 12,499 $ 12,299 $ 17,453 $ 17,253 200-10% $ 23,173 $ 23,113 $ 15,435 $ 15,315 200-15% $ 15,428 $ 15,368 $ 19,217 $ 19,137 CVX-Chevron DD-Dupont Gross Balance Net Balance Gross Balance Net Balance Buy and Hold $ 32,938 $ 32,918 $ 9,737 $ 9,717 5 x 20 $ 14,911 $ 13,191 $ 5,073 $ 3,353 20 x 200 $ 16,065 $ 15,705 $ 4,241 $ 3,881 100-0% $ 9,503 $ 7,803 $ 8,073 $ 6,673 100-2% $ 12,866 $ 12,386 $ 7,762 $ 7,222 100-5% $ 17,158 $ 16,958 $ 8,033 $ 7,773 100-10% $ 16,970 $ 16,870 $ 4,363 $ 4,203 100-15% $ 22,692 $ 22,652 $ 6,260 $ 6,200 150-0% $ 10,959 $ 9,539 $ 5,324 $ 3,984 150-2% $ 15,759 $ 15,299 $ 5,475 $ 4,955 150-5% $ 15,271 $ 15,071 $ 5,103 $ 4,843 150-10% $ 23,696 $ 23,636 $ 5,179 $ 5,059 150-15% $ 16,878 $ 16,818 $ 3,374 $ 3,274 200-0% $ 10,625 $ 8,825 $ 3,292 $ 1,992 200-2% $ 14,066 $ 13,586 $ 4,656 $ 4,156 200-5% $ 12,739 $ 12,519 $ 4,144 $ 3,864 200-10% $ 25,148 $ 25,088 $ 4,482 $ 4,362 200-15% $ 15,355 $ 15,295 $ 3,355 $ 3,255
  • 29. 20 DIS-Disney GE-General Electric Gross Balance Net Balance Gross Balance Net Balance Buy and Hold $ 10,548 $ 10,528 $ 18,492 $ 18,472 5 x 20 $ 2,729 $ 949 $ 9,671 $ 8,031 20 x 200 $ 13,363 $ 13,163 $ 22,174 $ 21,994 100-0% $ 13,795 $ 12,515 $ 9,766 $ 8,306 100-2% $ 12,384 $ 11,944 $ 13,924 $ 13,584 100-5% $ 14,740 $ 14,480 $ 13,392 $ 13,172 100-10% $ 7,949 $ 7,769 $ 20,424 $ 20,344 100-15% $ 7,540 $ 7,440 $ 11,419 $ 11,339 150-0% $ 12,565 $ 11,565 $ 14,386 $ 13,466 150-2% $ 9,521 $ 9,121 $ 16,336 $ 16,056 150-5% $ 11,384 $ 11,184 $ 21,792 $ 21,672 150-10% $ 7,691 $ 7,531 $ 21,757 $ 21,677 150-15% $ 7,419 $ 7,319 $ 18,469 $ 18,409 200-0% $ 10,564 $ 9,744 $ 15,803 $ 15,103 200-2% $ 12,211 $ 11,971 $ 16,730 $ 16,470 200-5% $ 10,604 $ 10,444 $ 20,792 $ 20,692 200-10% $ 7,445 $ 7,305 $ 22,755 $ 22,695 200-15% $ 10,965 $ 10,885 $ 27,775 $ 27,735 GM-General Motors HD-Home Depot Gross Balance Net Balance Gross Balance Net Balance Buy and Hold $ 7,189 $ 7,169 $ 14,642 $ 14,622 5 x 20 $ 14,377 $ 12,857 $ 4,756 $ 3,036 20 x 200 $ 4,401 $ 4,161 $ 15,237 $ 14,997 100-0% $ 13,344 $ 12,224 $ 6,789 $ 5,309 100-2% $ 12,376 $ 11,856 $ 10,476 $ 9,936 100-5% $ 10,730 $ 10,450 $ 8,126 $ 7,766 100-10% $ 7,506 $ 7,326 $ 13,635 $ 13,495 100-15% $ 3,681 $ 3,541 $ 12,308 $ 12,208 150-0% $ 10,428 $ 9,548 $ 11,157 $ 9,877 150-2% $ 13,896 $ 13,516 $ 13,755 $ 13,335 150-5% $ 10,005 $ 9,785 $ 14,051 $ 13,831 150-10% $ 7,447 $ 7,287 $ 15,362 $ 15,222 150-15% $ 4,895 $ 4,775 $ 19,786 $ 19,726 200-0% $ 9,571 $ 8,711 $ 14,884 $ 14,064 200-2% $ 9,008 $ 8,648 $ 14,062 $ 13,682 200-5% $ 7,502 $ 7,302 $ 15,468 $ 15,288 200-10% $ 6,178 $ 6,058 $ 15,864 $ 15,764 200-15% $ 3,937 $ 3,817 $ 20,159 $ 20,099
  • 30. 21 HPQ-Hewlett Packard IBM-IBM Gross Balance Net Balance Gross Balance Net Balance Buy and Hold $ 22,182 $ 22,162 $ 21,442 $ 21,422 5 x 20 $ 6,857 $ 5,197 $ 27,108 $ 25,568 20 x 200 $ 28,741 $ 28,601 $ 7,759 $ 7,439 100-0% $ 20,267 $ 18,947 $ 9,635 $ 8,275 100-2% $ 26,717 $ 26,257 $ 8,170 $ 7,630 100-5% $ 29,766 $ 29,546 $ 8,634 $ 8,294 100-10% $ 30,026 $ 29,886 $ 10,001 $ 9,861 100-15% $ 17,705 $ 17,585 $ 9,750 $ 9,630 150-0% $ 26,418 $ 25,678 $ 12,576 $ 11,396 150-2% $ 29,837 $ 29,497 $ 13,807 $ 13,427 150-5% $ 35,987 $ 35,827 $ 12,165 $ 11,925 150-10% $ 35,297 $ 35,197 $ 11,995 $ 11,875 150-15% $ 18,146 $ 18,046 $ 9,594 $ 9,494 200-0% $ 28,995 $ 28,335 $ 10,890 $ 9,850 200-2% $ 36,049 $ 35,769 $ 8,529 $ 8,109 200-5% $ 26,027 $ 25,867 $ 7,159 $ 6,919 200-10% $ 30,721 $ 30,621 $ 10,738 $ 10,618 200-15% $ 17,349 $ 17,249 $ 8,448 $ 8,348 INTC-Intel JNJ-Johnson & Johnson Gross Balance Net Balance Gross Balance Net Balance Buy and Hold $ 15,030 $ 15,010 $ 24,029 $ 24,009 5 x 20 $ 11,292 $ 9,852 $ 9,312 $ 7,552 20 x 200 $ 16,980 $ 16,800 $ 15,805 $ 15,605 100-0% $ 13,054 $ 11,454 $ 9,535 $ 8,075 100-2% $ 11,378 $ 10,738 $ 11,012 $ 10,572 100-5% $ 17,490 $ 17,130 $ 15,255 $ 15,055 100-10% $ 16,994 $ 16,814 $ 11,258 $ 11,158 100-15% $ 11,581 $ 11,441 $ 12,558 $ 12,518 150-0% $ 18,618 $ 17,778 $ 13,729 $ 12,749 150-2% $ 18,621 $ 18,181 $ 14,825 $ 14,525 150-5% $ 17,030 $ 16,770 $ 16,144 $ 15,964 150-10% $ 22,879 $ 22,719 $ 12,726 $ 12,646 150-15% $ 12,478 $ 12,358 $ 12,748 $ 12,708 200-0% $ 13,951 $ 13,291 $ 17,959 $ 17,159 200-2% $ 15,167 $ 14,827 $ 18,331 $ 18,091 200-5% $ 14,112 $ 13,872 $ 13,679 $ 13,519 200-10% $ 21,031 $ 20,911 $ 11,873 $ 11,773 200-15% $ 14,900 $ 14,800 $ 12,784 $ 12,724
  • 31. 22 JPM-JP Morgan KO-Coca Cola Gross Balance Net Balance Gross Balance Net Balance Buy and Hold $ 15,991 $ 15,971 $ 10,933 $ 10,913 5 x 20 $ 11,469 $ 9,749 $ 7,643 $ 6,043 20 x 200 $ 7,482 $ 7,202 $ 5,107 $ 4,847 100-0% $ 7,286 $ 5,766 $ 7,075 $ 5,755 100-2% $ 6,053 $ 5,393 $ 9,178 $ 8,718 100-5% $ 6,365 $ 6,025 $ 10,713 $ 10,513 100-10% $ 5,564 $ 5,364 $ 7,466 $ 7,346 100-15% $ 9,899 $ 9,799 $ 3,965 $ 3,865 150-0% $ 5,624 $ 4,204 $ 7,192 $ 6,152 150-2% $ 6,765 $ 6,245 $ 6,905 $ 6,545 150-5% $ 7,514 $ 7,254 $ 6,729 $ 6,509 150-10% $ 6,703 $ 6,543 $ 7,190 $ 7,070 150-15% $ 7,476 $ 7,376 $ 5,316 $ 5,236 200-0% $ 6,119 $ 5,019 $ 6,324 $ 5,324 200-2% $ 6,865 $ 6,345 $ 6,202 $ 5,842 200-5% $ 8,127 $ 7,887 $ 6,028 $ 5,808 200-10% $ 6,769 $ 6,629 $ 7,021 $ 6,901 200-15% $ 8,019 $ 7,919 $ 4,809 $ 4,709 MCD-McDonalds MMM-3M Gross Balance Net Balance Gross Balance Net Balance Buy and Hold $ 28,189 $ 28,169 $ 24,724 $ 24,704 5 x 20 $ 12,714 $ 11,174 $ 13,189 $ 11,549 20 x 200 $ 21,187 $ 20,927 $ 8,923 $ 8,603 100-0% $ 17,118 $ 15,978 $ 6,544 $ 5,124 100-2% $ 21,580 $ 21,160 $ 6,382 $ 5,842 100-5% $ 19,041 $ 18,761 $ 5,358 $ 5,038 100-10% $ 24,592 $ 24,472 $ 11,134 $ 11,034 100-15% $ 50,006 $ 49,966 $ 10,631 $ 10,611 150-0% $ 17,651 $ 16,531 $ 5,678 $ 4,278 150-2% $ 20,233 $ 19,873 $ 6,429 $ 5,889 150-5% $ 15,257 $ 15,017 $ 4,916 $ 4,616 150-10% $ 28,375 $ 28,275 $ 10,570 $ 10,470 150-15% $ 47,057 $ 47,017 $ 8,071 $ 8,011 200-0% $ 15,543 $ 14,423 $ 7,140 $ 5,840 200-2% $ 23,512 $ 23,192 $ 6,558 $ 6,138 200-5% $ 25,341 $ 25,181 $ 6,391 $ 6,151 200-10% $ 36,338 $ 36,278 $ 12,919 $ 12,839 200-15% $ 41,922 $ 41,882 $ 15,043 $ 15,003
  • 32. 23 MRK-Merck MSFT-Microsoft Gross Balance Net Balance Gross Balance Net Balance Buy and Hold $ 14,900 $ 14,880 $ 25,214 $ 25,194 5 x 20 $ 12,266 $ 10,806 $ 22,452 $ 20,932 20 x 200 $ 15,235 $ 15,075 $ 11,725 $ 11,425 100-0% $ 12,610 $ 10,990 $ 9,379 $ 8,019 100-2% $ 12,210 $ 11,670 $ 10,275 $ 9,715 100-5% $ 13,906 $ 13,646 $ 9,470 $ 9,130 100-10% $ 16,436 $ 16,316 $ 15,631 $ 15,491 100-15% $ 13,259 $ 13,159 $ 18,663 $ 18,583 150-0% $ 11,442 $ 10,442 $ 15,601 $ 14,381 150-2% $ 13,028 $ 12,708 $ 13,367 $ 12,927 150-5% $ 13,791 $ 13,591 $ 11,807 $ 11,547 150-10% $ 13,202 $ 13,082 $ 15,962 $ 15,842 150-15% $ 13,523 $ 13,443 $ 17,240 $ 17,160 200-0% $ 10,544 $ 9,544 $ 19,514 $ 18,574 200-2% $ 13,235 $ 12,895 $ 17,235 $ 16,895 200-5% $ 16,694 $ 16,554 $ 18,451 $ 18,271 200-10% $ 14,013 $ 13,913 $ 24,382 $ 24,302 200-15% $ 12,628 $ 12,548 $ 14,941 $ 14,861 PFE-Pfizer PG-Proctor & Gamble Gross Balance Net Balance Gross Balance Net Balance Buy and Hold $ 11,109 $ 11,089 $ 21,628 $ 21,608 5 x 20 $ 9,101 $ 7,541 $ 11,656 $ 10,056 20 x 200 $ 7,529 $ 7,249 $ 14,542 $ 14,322 100-0% $ 5,582 $ 4,022 $ 18,682 $ 17,302 100-2% $ 7,588 $ 7,008 $ 21,311 $ 21,011 100-5% $ 6,276 $ 5,956 $ 17,979 $ 17,799 100-10% $ 6,902 $ 6,762 $ 11,835 $ 11,735 100-15% $ 4,798 $ 4,698 $ 7,119 $ 7,059 150-0% $ 3,898 $ 2,418 $ 16,534 $ 15,494 150-2% $ 5,076 $ 4,516 $ 18,808 $ 18,528 150-5% $ 5,784 $ 5,524 $ 14,498 $ 14,338 150-10% $ 6,544 $ 6,424 $ 14,169 $ 14,069 150-15% $ 7,185 $ 7,105 $ 12,106 $ 12,026 200-0% $ 8,708 $ 7,408 $ 13,288 $ 12,368 200-2% $ 7,973 $ 7,553 $ 13,667 $ 13,407 200-5% $ 6,558 $ 6,338 $ 14,310 $ 14,170 200-10% $ 9,334 $ 9,234 $ 14,205 $ 14,125 200-15% $ 7,898 $ 7,818 $ 7,943 $ 7,863
  • 33. 24 T-AT&T UTX-United Tech Gross Balance Net Balance Gross Balance Net Balance Buy and Hold $ 15,720 $ 15,700 $ 47,662 $ 47,642 5 x 20 $ 6,649 $ 4,949 $ 20,972 $ 19,472 20 x 200 $ 10,128 $ 9,888 $ 25,657 $ 25,477 100-0% $ 5,437 $ 3,777 $ 16,901 $ 15,121 100-2% $ 7,133 $ 6,553 $ 16,924 $ 16,364 100-5% $ 6,162 $ 5,822 $ 22,342 $ 22,122 100-10% $ 14,311 $ 14,191 $ 23,145 $ 23,025 100-15% $ 15,525 $ 15,445 $ 13,853 $ 13,753 150-0% $ 7,720 $ 6,340 $ 16,070 $ 14,530 150-2% $ 7,882 $ 7,442 $ 18,645 $ 18,225 150-5% $ 8,329 $ 8,069 $ 27,400 $ 27,200 150-10% $ 14,948 $ 14,848 $ 26,250 $ 26,150 150-15% $ 11,654 $ 11,574 $ 12,827 $ 12,727 200-0% $ 15,051 $ 14,211 $ 19,754 $ 18,914 200-2% $ 14,021 $ 13,741 $ 16,974 $ 16,614 200-5% $ 9,370 $ 9,150 $ 18,938 $ 18,758 200-10% $ 18,891 $ 18,811 $ 22,332 $ 22,232 200-15% $ 17,528 $ 17,468 $ 10,633 $ 10,533 VZ-Verizon WMT-Wal Mart Gross Balance Net Balance Gross Balance Net Balance Buy and Hold $ 14,282 $ 14,262 $ 25,967 $ 25,947 5 x 20 $ 12,447 $ 10,947 $ 9,500 $ 7,800 20 x 200 $ 7,817 $ 7,597 $ 10,552 $ 10,212 100-0% $ 9,239 $ 8,059 $ 5,399 $ 3,879 100-2% $ 10,734 $ 10,314 $ 6,204 $ 5,544 100-5% $ 10,933 $ 10,693 $ 5,382 $ 5,042 100-10% $ 6,444 $ 6,264 $ 8,079 $ 7,919 100-15% $ 10,704 $ 10,644 $ 19,580 $ 19,540 150-0% $ 11,511 $ 10,591 $ 5,338 $ 3,818 150-2% $ 7,447 $ 7,067 $ 5,678 $ 5,078 150-5% $ 8,109 $ 7,869 $ 5,161 $ 4,821 150-10% $ 10,452 $ 10,332 $ 7,878 $ 7,738 150-15% $ 12,248 $ 12,188 $ 15,920 $ 15,880 200-0% $ 10,285 $ 9,485 $ 5,002 $ 3,802 200-2% $ 8,812 $ 8,492 $ 6,775 $ 6,215 200-5% $ 7,053 $ 6,833 $ 7,062 $ 6,782 200-10% $ 11,364 $ 11,264 $ 11,355 $ 11,235 200-15% $ 12,750 $ 12,690 $ 18,031 $ 17,991
  • 34. 25 XOM-Exxon Gross Balance Net Balance Buy and Hold $ 37,689 $ 37,669 5 x 20 $ 15,045 $ 13,425 20 x 200 $ 20,201 $ 19,861 100-0% $ 10,415 $ 8,475 100-2% $ 17,626 $ 17,186 100-5% $ 13,343 $ 13,083 100-10% $ 24,406 $ 24,346 100-15% $ 17,836 $ 17,796 150-0% $ 11,676 $ 10,236 150-2% $ 15,878 $ 15,418 150-5% $ 12,891 $ 12,671 150-10% $ 25,322 $ 25,262 150-15% $ 16,059 $ 16,019 200-0% $ 13,861 $ 12,581 200-2% $ 15,453 $ 15,033 200-5% $ 15,506 $ 15,326 200-10% $ 25,137 $ 25,077 200-15% $ 18,537 $ 18,497