Nell’iperspazio con Rocket: il Framework Web di Rust!
Total sequestered carbon stock of mangifera indica
1. Journal of Environment and Earth Science www.iiste.org
ISSN 2224-3216 (Paper) ISSN 2225-0948 (Online)
Vol 2, No.1, 2012
Total Sequestered Carbon Stock of Mangifera indica
Balbhim Chavan, Ganesh Rasal
Dr. Babasaheb Ambedkar Marathwada University,
Aurangabad-431 004, (M.S.) India.
Abstract:
Carbon sequestration by green plants is a suitable way to reduce atmospheric CO2. In the present
investigation aboveground and belowground carbon sequestration potential of Mangifera indica from nine
sectors of Aurangabad city was measured. The total standing aboveground biomass and belowground
biomass of Mangifera indica are 82.83tha-1 and 21.54tha-1 respectively, while total standing biomass of
Mangifera indica in 2847 hectares of Aurangabad is 104.41tha-1. The sequestered carbon stalk in
aboveground and belowground standing biomass of Mangifera indica are 44.73 tha-1 and 11.63 tha-1
respectively while, total sequestered carbon of Mangifera indica in 2847 hectares area is 56.36 tha-1. The
newly developed allometric equations for Mangifera indica on the diameter class basis for AGB as a
function for DBH and height have shown high correlations.
Key words: Aboveground carbon, Allometric equation, belowground carbon, CDM, carbon sequestration
potential, climate change, carbon stock, Total Biomass.
1. Introduction
Global emission of carbon dioxide has increased by 18% and is damaging the environment by reaching to
the highest level after 1750. Its level increased per year by 1.5ppb in year 1990-2000, by 2ppb in
2001-2009 and by 2.3ppb in 2009-2010 which is highest in recent decades. It is contributing to global
warming and climate change as discussed in earth summit held in 1992 at Rio De-Janerio, Quoto protocol
signed in 1997 at Japan, Copenhagen conference in 2009 held at Denmark, Kankun conference in 2010
held at Maxico and Darban conference held in 2011 in South Africa (D.M., 2011). Many efforts are being
made to reduce atmospheric carbon dioxide. The Kyoto Protocol, prepared by the United Nations in the
Framework of Convention on Climate Change stipulates Clean Development Mechanisms (CDM) and its
Joint Implementation whereby storage of carbon in various terrestrial sinks may be acceptable for insertion
in national greenhouse gas inventories of each nation. Reducing greenhouse gas emissions including carbon
dioxide can be achieved by controlling emissions and avoiding unadvisable land use changes. Carbon
sequestration in growing forests is known to be a cost-effective option for mitigation of global warming and
global climatic change. Sequestration can be defined as the net removal of carbon dioxide from the
atmosphere into long lived carbon pools. Estimates of carbon stocks and stock changes in tree biomass
(above and belowground) are necessary for reporting to the United Nations Framework Convention on
Climate Change (UNFCCC) and will be required for Kyoto Protocol reporting (Green et al. 2007; Almgir
and Al-Amin, 2007).
The increasing carbon emission is of major concerns for entire world as well addressed in Kyoto protocol
(Chavan, and Rasal, 2010; Ravindranath, et. al., 1997). Biomass production in different forms plays
important role in carbon sequestration in trees. These carbon pools are composed of live and dead above and
below ground biomass, and wood products with long and short life and potential uses. Above-ground
biomass, below-ground biomass, dead wood, litter, and soil organic matter are the major carbon pools in
any ecosystem (FAO, 2005; IPCC, 2003; IPCC, 2006). Trees play an important role in the reduction of
37
2. Journal of Environment and Earth Science www.iiste.org
ISSN 2224-3216 (Paper) ISSN 2225-0948 (Online)
Vol 2, No.1, 2012
carbon dioxide from atmosphere by carbon sequestration. Active absorption of CO2 from the atmosphere
through the process of photosynthesis and its subsequent storage in different plant parts in the form of
biomass in growing trees is the carbon storage (Baes et. al. 1977 and Chavan et. al. 2010). The assessment
of biomass equations for the efforts to improve carbon budget estimates is based on the link between
individual-tree and whole-stand biomass estimates (Clutter et al., 1983; Parresol, 1999), coupled with the
assumption that wood mass is about 50% carbon (Birdsey, 1992). The objective of this paper is to estimate
sequestered carbon of Mangifera indica from Aurangabad.
1.1 Plant study
The scientific name of mango tree is Mangifera indica L. It belongs to Anacardiaceae family. The canopy
of Mangifera indica is evergreen and fast growing tree. Mango is a common garden tree throughout the
tropics. Most of the fruit trees belonging to this family that are commonly known as mango trees and
belong to the species Mangifera indica. The wild Mangifera species are generally edible but have lower
quality fruits. The mango tree have adapted throughout the tropics and subtropics. Much of the spread and
naturalization has come about in conjunction with the spread of human populations. Mango tree is an
evergreen tree changeable in height from 5 to 40m in with a short straight bole reaching a diameter to 100cm.
The total tree biomass is composed of following components (Bally, 2006; Chavan and Rasal, 2011).
1. Bark & Branches: The bark of mango tree is somewhat rough, fissured and dark brown to grey. Its
twigs are rounded, stout, and glabrous with prominent leaf scars. Its shoots are reddish-green and
smooth, turning light brown shoots.
2. Leaves: The leaves of mango tree are simple, alternate, petiolate and at 2-10 cm and distinctly
thickened at the lower end and smell of turpentine when these are crushed. They are glabrous in
appearance and shaped like front. They extend from 15-30 cm in length and 4-6 cm in width. They
are reddish-brown when young and turn a shiny dark green with age.
3. Flowers: The flowers are in bunches, 5-7mm across and may be male or hermaphrodite. They
consist of 5 green triangular sepals, 5 clawed with curved petals, Flowers appear in the period of
December to May and fruits in April to August.
4. Fruits: The mango fruits are botanically considered to be edible drupes. They are initially with
green peels and turn various shades of red, yellow and green colors after growth and when ripe. The
fruits of commercially cultivated species are larger in size and more in weights. The pulp surrounds
a stony hard coat that contains a seed in each fruits.
The mango fruit is an important source of sustenance for birds, bats, insects, and mammals. Although
grown widely, mangos prefer a warm, frost-free climate with a well-defined winter dry season. Rain and
high humidity during flowering stage and fruit development stage reduces fruit yields. The tree generally
flowers in mid to late winter, with fruits maturing in the early to mid-summer months. Mango trees are
usually between 3 and 10 m (10–33 ft.) tall but can reach up to 30 m (100 ft.) in some natural forest
situations. The canopy is evergreen with a generally spreading habit. The heavy canopy of the mango is a
good shelter and shade for both animals and humans. Mangos are well adapted to cultivation in various
soils and have been grown commercially for centuries. Today, mangos are well recognized and eaten
throughout the world. They are regarded as one of the most popular and esteemed tropical fruits (Bally,
2006).
38
3. Journal of Environment and Earth Science www.iiste.org
ISSN 2224-3216 (Paper) ISSN 2225-0948 (Online)
Vol 2, No.1, 2012
1.2 Distribution: The genus Mangifera originates in tropical Asia. The large numbers of species are found
in Borneo, Java, Sumatra, and the Malay Peninsula. The most-cultivated Mangifera species, M. indica
(mango), has its origins in India and Myanmar (Bally, 2006).
India ranks first among world’s mango producing countries. It accounts for about 50% of the world’s mango
production. India’s shared around 12 million tons as against world’s production of 23 million tons as figured
in 2002-03. An increasing trend has been observed in world mango production averaging 22 million metric
tons per year. In India the major mango producing States are Andhra Pradesh, Bihar, Gujarat, Karnataka,
Maharashtra, Orissa, Tamil Nadu, Uttar Pradesh and West Bengal. Other States where mangoes are grown
include Madhya Pradesh, Kerala, Haryana, Punjab etc. Source: Database of National Horticulture Board,
Ministry of Agriculture, Govt. of India. Worldwide production is mostly concentrated in Asia, accounting for
75%. It is followed by South and Northern America with about 10% share. The other major mango producing
countries include China, Thailand, Mexico, Pakistan, Philippines, Indonesia, Brazil, Nigeria and Egypt
(ESD, 2009).
1.3 Economic Importance: The fruits of mango are is incredibly popular with the ample due to their wide
range of adaptability, high nutritive value, richness in variety, delicious taste and excellent flavor. Mango
fruit is rich source of vitamin A and C. Good mango varieties contain 20% of total soluble sugars. The acid
content of ripe desert fruit varies from 0.2 to 0.5 % and protein content is about 1 %. The wood is relatively
soft and used as timber and dried twigs are used for religious purposes. The mango fruit kernel is most
important part and contains about 8-10% good quality fat useful for saponification. Its starch is used in
confectionery industries. Mango has medicinal uses too. The ripe fruit is high in calories with diuretic and
laxative properties. It helps to increase digestive capacity (Bally, 2006; ESD, 2009).
2. Experimental Methodology
2.1 Study area:
0
The study is located in the state of Maharashtra, in India. Aurangabad is located at the latitude 19 53’47”N
0
and longitude 75 23’54” E. The average day temperature ranges from 27.70C to 38.00 C while it falls from
26.90C to 20.00C during night. The average annual rainfall in Aurangabad city and adjoining area is 725.8
mm (28.57''). Relative humidity is extremely low in this region for major part of the year which ranges
between 35 to 50%, while it is highest (85%) during monsoon. The total land portion under forest cover is
2
about 557 km which is only 7.6% area of total land area in Aurangabad (SFR, 2009). The total 28.47
sq.km area of Aurangabad city is selected for the carbon sequestration study.
The total 2847 hectares of study area from Aurangabad was selected for the carbon sequestration study. The
fig.1 shows the 9 sectors from Aurangabad as sampling locations for Mangifera indica trees studied. The
samples were collected from a representative tree of each species from each sampling plot from the study
region.
2.2 Biophysical measurements:
The height and diameter at breast height (DBH) are two main biophysical measurements which measured
for each tree sample. The mango tree height measured by Theodolite instrument follower the procedure
given elsewhere (Chavan and Rasal, 2010; Chavan and Rasal, 2012). The tree diameter was measured at
breast height (DBH) by using diameter measure tape.
2.3 Estimation of Aboveground biomass:
39
4. Journal of Environment and Earth Science www.iiste.org
ISSN 2224-3216 (Paper) ISSN 2225-0948 (Online)
Vol 2, No.1, 2012
Above-ground biomass includes all living biomass above the soil. The aboveground biomass (AGB) has
been calculated by multiplying volume of biomass and wood density (Ravindranath and Ostwald, 2008).
The volume was calculated based on diameter and height. The wood density value for the Mangifera indica
species obtained from web (www.worldagroforestry.org).
AGB (g) = Volume of biomass (cm3) X wood density (g/cm3)
The biomass of all samples Mangifera indica trees in the all the sample plots (t) was calculated and
extrapolating it for total area (tha-1).
2.4 Estimation of Belowground biomass:
The Below Ground Biomass (BGB) includes all biomass includes all biomass of live roots excluding fine
roots having <2mm diameter (Chavan and Rasal, 2011). Biomass estimation equations for tree roots are
relatively uncommon in the literature. The belowground biomass (BGB) has been calculated by multiplying
above-ground biomass taking 0.26 as the root to shoot ratio (Cairns et al. 1997; Ravindranath and Ostwald,
2008).
Belowground biomass (tha-1) = 0.26 X above-ground biomass (tha-1)
3. Result and Discussion
3.1 Biomass estimation
The estimation of the aboveground and belowground biomass in the selected tree species was performed by
estimating carbon percentage and by measuring the tree height, DBH and wood density. The study
conducted by Chavan and Rasal (2011) in University campus of Aurangabad found that carbon content of
dry biomass was 54% for Mangifera indica. The carbon concentration of different tree parts was rarely
measured directly, but generally assumed to be 50% of the dry weight on the basis of literature (Losi et
al., 2003; Jana et al., 2009) as the content of carbon in woody biomass in any component of forest on
average is around 50% of dry matter (Paladinic et al., 2009).
The standing biomass stalks in Mangifera indica trees in Aurangabad are shown in Table 1. It was observed
that sector no. 4 contain highest Mangifera indica in aboveground biomass, belowground biomass and total
standing biomass (32.31 tha-1, 8.40 tha-1 and 40.71 tha-1) followed in sector no. 8 (8.27 tha-1, 2.15 tha-1 and
10.42 tha-1), sector no. 6 (7.61 tha-1, 1.9 tha-1 and 9.59 tha-1), sector no. 9 (7.45 tha-1, 1.94 tha-1 and 9.39
tha-1), sector no. 5 (6.82 tha-1,1.79 tha-1 and 8.61 tha-1), sector no. 7 (6.79 tha-1, 1.77 tha-1 and 8.56 tha-1),
sector no. 2 (5.57 tha-1, 1.45 tha1 and 7.02 tha-1), sector no. 3 (5.39 tha-1, 1.40 tha-1 and 6.79 tha-1) and
lowest at sector no.1 (2.61 tha-1, 0.68 tha-1 and 3.29 tha-1). The total standing aboveground biomass and
belowground biomass of Mangifera indica were 82.83 tha-1 and 21.54 tha-1 respectively while, total
standing biomass of Mangifera indica in 2847 hectares area were 104.41 tha-1.
3.2 Carbon stock estimation
The sequestered carbon stalks in Mangifera indica trees in Aurangabad are shown in Table 2 and Fig. 2&3.
It was observed that sector no. 4 contain highest Mangifera indica carbon stalk in aboveground,
40
5. Journal of Environment and Earth Science www.iiste.org
ISSN 2224-3216 (Paper) ISSN 2225-0948 (Online)
Vol 2, No.1, 2012
belowground and total carbon sequestered (17.44 tha-1, 4.53 tha-1 and 21.97 tha-1) followed in sector no. 8
(4.46 tha-1, 1.16 tha-1 and 5.62 tha-1), sector no. 6 (4.11 tha-1, 1.07 tha-1and 5.18 tha-1), sector no. 9 (4.02
tha-1, 1.04 tha-1and 5.06 tha-1), sector no. 5 (3.65 tha-1, 0.97 tha-1 and 4.62 tha-1), sector no. 7 (3.67 tha-1,
0.95tha-1and 4.62 tha-1), sector no. 2 (3.01 tha-1, 0.78 tha-1 and 3.79 tha-1), sector no. 3 (2.91 tha-1, 0.75 tha-1
and 3.66 tha-1) and lowest at sector no. 1 (1.41 tha-1, 0.36 tha-1 and 1.77 tha-1). The sequestered carbon stalk
in aboveground and belowground standing biomass of Mangifera indica were 44.73 tha-1 and 11.63 tha-1
respectively while, total sequestered carbon of Mangifera indica in 2847 hectares area were 56.36 tha-1
(Table 2). Hairiah, (2009) referred as 1t of Carbon is equal to 3.67tCO2. The atmospheric CO2 captured by
Mangifera indica from the Aurangabad city were 206.84 tCO2 ha-1.
The total of aboveground biomass and belowground biomass together as sequestered carbon stalk per
hectare as estimated from university campus of Aurangabad for Mangifera indica it was 30.6 Kg C ha-1
(Chavan and Rasal, 2011). The total aboveground biomass carbon stock per hectare as estimated for Shorea
robusta, Albizzia lebbek, Tectona grandis and Artocarpus integrifolia were 5.22, 6.26, 7.97 and 7.28 t C
ha-1, respectively in selected forest stands (Jana, 2009). The average standing stock of organic carbon in
Mangifera indica is higher than organic carbon content in selected well grown trees of Dr. B. A. M.
University campus which was 1.65 t/tree (Chavan and Rasal, 2010).
The Aboveground and Belowground carbon Total carbon stalk of a tree has been evaluated by sum of
Aboveground and belowground carbon stalk of Mangifera indica in (tha-1). From the Fig. 4 it is revealed
that the total carbon stalk (tha-1) at Mangifera indica from 9sectors of Aurangabad the highest carbon
content in sector 4th it was 39% followed by sector 8 (10%), sector 6 & 9 (9% each), sector 5&7 (8% each),
sector 2 & 3 (7% each) and lowest at sector 1 (3%).
3.3 Statistical Analysis
Biomass equations are used to estimate the weights of the tree based on DBH and height of the trees in the
sample area. Biomass equations are available only for some dominant commercial tree species. The
equations which are available are often only species specific and also location specific. Neither, biomass
equations developed using mature trees can be used for younger trees, nor the equations of younger trees
for mature trees. Biomass equations are not available for most local or native tree species in many regions.
It makes desirable to develop biomass equations wherever possible to suite the local tree species and age of
the stand trees in different study regions (Ravindranath and Ostwald, 2008; Chavan and Rasal, 2011).
Allometric equations describe the relation between biomass Vs diameter and height of tree. To test the
effect height and diameter on aboveground biomass of the tree the model is used Y = a + b (D) + c (H).
Where, Y is aboveground biomass (gm), D is diameter at breast height (cm), H is total height of tree (m), a
is the intercept and b, C = regression coefficients. For Mangifera indica the biomass equations developed
on the basis of diameter class < 25cm, >25 to <65 cm diameter and >65cm (Table 3).
The allometric equations were developed for aboveground biomass with height and diameter of Mangifera
indica tree on the diameter class viz. diameter below 25cm, diameter above 25cm to 65cm and diameter
above 65cm (Table 4). From the developed allometric equations for total above ground biomass (AGB) of
Mangifera indica as a function of Diameter at Breast Height and Height showed high correlation was for
equation for <25cm (95.8%), equation >25cm to <65cm (93.8%) and >65cm it was 98.6cm and high
significant P>0.00 value.
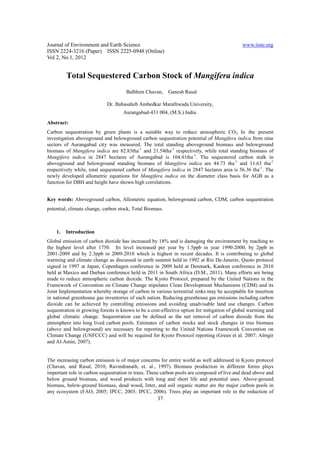
Fig.1: Allometric relationship between aboveground biomass (Kg) with Height (m) and Diameter (m) and
DBH <25cm for Mangifera indica tree. The developed allometric equation is B = - 2.43 + 0.154 D + 0.193
41
6. Journal of Environment and Earth Science www.iiste.org
ISSN 2224-3216 (Paper) ISSN 2225-0948 (Online)
Vol 2, No.1, 2012
H, where B is above-ground biomass (Kg) with D (cm) is diameter at breast height (1.3m) and H is (ft) total
height.
Biomass (Kg) Vs Diameter & height
0.4
Biomass(Kg) = - 2.43 + 0.154 D + 0.193 H
0.3 R-sq = 95.8%
0.2
Biomass (Kg)
0.1
0.0
-0.1
-0.2
-0.3
0.0 0.5 1.0 1.5 2.0 2.5 3.0 3.5
DBH & Height
Fig.2: Allometric relationship between aboveground biomass (Kg) with Height (m) and Diameter (m) with
DBH >25cm to <65cm for Mangifera indica tree. The developed allometric equation is B = - 26.6 + 0.614
D + 1.39 H, where B is above-ground biomass (Kg) with D (cm) is diameter at breast height (1.3m) and H
is (ft) total height.
Biomass (Kg) Vs DBH & Height
8
Biomass(Kg) = - 26.6 + 0.614 D + 1.39 H
6 R-sq = 93.8%
4
Biomass (Kg)
2
0
-2
-4
0 10 20 30 40
DBH & Height
Fig.2: Allometric relationship between aboveground biomass (Kg) with Height (m) and Diameter (m) with
DBH >65cm for Mangifera indica tree. The developed allometric equation is B = - 26.6 + 0.614 D + 1.39
H, where B is above-ground biomass (Kg) with D (cm) is diameter at breast height (1.3m) and H is (ft) total
height.
42
7. Journal of Environment and Earth Science www.iiste.org
ISSN 2224-3216 (Paper) ISSN 2225-0948 (Online)
Vol 2, No.1, 2012
Biomass (Kg) Vs DBH & Height
5.0 Biomass(Kg) = - 115 + 1.59 D + 3.38 H
R-sq = 98.6%
2.5
Biomass (Kg)
0.0
-2.5
-5.0
20 40 60 80 100 120
DBH & Height
Site specific equations must be considered for accurate estimation of above-ground biomass in logged-over
tropical rainforests, although several authors have stated that for tropical forests, local species-species
allometric relationships must be employed (Alves et al., 1997; Chave et al., 2004; 2005; Brown 1997;
Schroeder, 1997). The studies in both primary and secondary forests in Southeast Asia reported the
importance of site-specific equations for accurate biomass estimation based on application and/or
comparison of the proposed pan-tropic general models (Brown 1997 and Chave et al., 2005) and observed
biomass data biomass data sets for each forest type (Bauki et al., 2009; Kenzo et al., 2009). The above
studied species specific equations useful for accurate estimation of above-ground biomass in Mangifera
indica.
4 Conclusions:
Total standing biomass of Mangifera indica in 2847 hectares of Aurangabad are 104.41tha-1. The
sequestered carbon stalk in aboveground and belowground standing biomass of Mangifera indica are 44.73
tha-1 and 11.63 tha-1 respectively while, total sequestered carbon of Mangifera indica in 2847 hectares area
are 56.36 tha-1. The atmospheric CO2 captured by Mangifera indica from the Aurangabad city are 206.84
tCO2 ha-1. The allometric regression equations indicate high correlation and accurate relationship between
aboveground biomass as a function of both variables DBH and height in the Mangifera indica in the study
area.
References:
[1] Alves, D.S., Soares, J.V.S., Amaral, E.M.K., Mello, S.A.S., Almeida, O., Fernandes, S., Silveira,
A.M., 1997. Biomass of primary and secondary vegetation in Rondonia, western Brazilian Amazon.
Global change Biology, 3: 451-462.
[2] Bally Ian S.E., 2006. Mangifera indica, Species specific for pacific island Agroforestry, V.3,
WWW.traditionaltree.org.
[3] Birdsey, R.A. 1992. Carbon storage and accumulation in United States forest ecosystems. Gen.
Tech. Rep. WO-59. Washington, DC: U.S. Department of Agriculture, Forest Service. pp. 51.
[4] Brown S., 1997. Estimating Biomass and Biomass change of Tropical Forests: a Primer. Rome,
Italy; FAO Forestry Paper, 134, pp. 165.
[5] Chavan B.L. and Rasal G.B., 2010. Sequestered standing carbon stock in selective tree species
grown in University campus at Aurangabad, Maharashtra, India. IJEST, Vol.2 (7), 3003-3007.
43
8. Journal of Environment and Earth Science www.iiste.org
ISSN 2224-3216 (Paper) ISSN 2225-0948 (Online)
Vol 2, No.1, 2012
[6] Chavan, B. L. and Rasal, G. B., 2009. Carbon storage in Selective Tree Species in University
Campus at Aurangabad, Maharashtra, India. Proceeding of International conference & Exhibition
on RAEP, Agra, India, 119-130.
[7] Chavan B.L. and Rasal G.B., 2011. Potentiality of Carbon Sequestration in six year ages young
plant from University campus of Aurangabad, Global Journal of Researches in Engineering, Vol.
11(7), 15-20.
[8] Rasal G. B., Babare M.G., and Chavan B. L., 2011. Sequestered carbon stalk in young Annona
reticulata plant in Aurangabad, International conference on Climate change and social issues at
Colombo, Sri Lanka paper presented.
[9] Chavan B.L. and Rasal G.B., (2012). “Carbon sequestration potential of Mangifera indica in its
various growth phases” 99th Indian Science Congress, Bhuvaneshwar, India paper presented.
[10] Chavan B. L. and Rasal G. B., (2012). Carbon Sequestration potential of young Annona reticulate
and Annona squamosa from University of Aurangabad, Research paper accepted for
International Journal of Physical and Social Sciences, ISSN 2249-2496, Vol.3, in press.
[11] Chave J, Andalo C, Brown S, Cairns MA, Chambers JQ, Eamus D, Fo¨lster FH, Fromard F,
Higuchi N, Lescure JP, Nelson BW, Ogawa H, Puig H, Riera B, Yamakura T., 2005. Tree
allometry and improved estimation of carbon stocks and balance in tropical forests. Oecologia
145:87–99.
[12] Chave J., Condit R., Aguilar S., Hernandez A., Lao S. and Perez R., 2004. Error propagation and
scaling for tropical forest biomass estimates. Phil Trans R Soc Lond B 359:409–420.
[13] Clutter, J.L.; Fortson, J.C.; Pienaar, L.V.; Brister, G.H.; Bailey, R.L. 1983. Timber management: a
quantitative approach. New York: John Wiley & Sons. pp.333.
[14] D.M., 2011. Divya Marathi Newspaper, 2011, Vol. 184(12).
[15] FAO. 1997. Estimating biomass and biomass change of tropical forests: a primer, Rome, Italy: FAO
Forestry Paper No.134.
[16] FAO. 2005. Support to national forest assessments. FAO Forestry Department website
(www.fao.org/forestry/site/24673/en).
[17] Green, R., Tobin, B., O’Shea, M., 2007. Above and below ground biomass measurements in an
unthinned stand of Sitka spruce (Picea sitchensis (Bong) Carr.). Eur. J. forest Res., 126: 179−188.
[18] IPCC (Intergovernmental Panel on Climate Change) 2003. Good practice guidance or land use,
land-use change and forestry. Institute for Global Environmental Strategies (IGES), Hayama.
[19] IPCC (Intergovernmental Panel on Climate Change) 2006. Guidelines for national greenhouse gas
inventories. Vol. 4, Agriculture, Forestry and other land use (AFLOLU). Institute for Global
Environmental strategies, Hayama, Japan.
[20] Jana, B. K., Biswas, S., Majumder, M., Roy, P. K., Mazumdar, A., 2009. Comparative Assessment
of Carbon Sequestration Rate and Biomass Carbon Potential of Young Shorea robusta and
Albizzia lebbek, International Journal of Hydro-Climatic Engineering Assoc. Water and
Enviro-Modeling, 1-15.
[21] Kenzo T., Furutani R., Hattori D., Kendawang J. J., Tanaka S., Sakurai K. and Ninomiya I., 2009.
Allometry equations for accurate estimation of above-ground biomass in loggedover tropical
rainforests in Sarawak, Malaysia. Journal of Forestry Research, 14: 365-372.
[22] Losi, C.J., Siccama, T.G., Condit, R., Morales, J.E., 2003. Analysis of alternative methods for
estimating carbon stock in young tropical plantations, Elsevier for For.Eco.Manag.184:355-368.
[23] Mohammed Alamgir., M. Al-Amin., 2007. Organic carbon stock in trees within different
Geopositions of Chittagaon (South) forest division, Bangladesh, Journal of Forestry Research,
18(3): 174-180.
[24] Paladinic, E.,Vuletic, D., Martinic, I., Marjanovic, H., Indir, K., Benko, M., and Novotny,V.,
2009. Forest biomass and sequestered carbon estimation according to main tree components on the
forest stand scale. Periodicum Biologorum, Vol.111, No.4, 459-466.
[25] Parresol, B.R. 1999. Assessing tree and stand biomass: a review with examples and critical
comparisons. Forest Science. 45: 573-593.
44
9. Journal of Environment and Earth Science www.iiste.org
ISSN 2224-3216 (Paper) ISSN 2225-0948 (Online)
Vol 2, No.1, 2012
[26] Ravindranath NH., Somashekhar BS, Gadgil M. 1997. Carbon flow in Indian forests, submitted to
the Ministry of Environment and Forest.
[27] Ravindranath, N.H. and Ostwald M., 2008. Carbon Inventory Methods Handbook for Greenhouse
Gas Inventory, Carbon Mitigation and Round wood Production Projects. Springer, Vol. 29.
[28] Schroeder P., Brown S., Birdsey JMR., Cieszewski C. 1997. Biomass estimation for temprate
broadleaf forests of the US using inventory data. Forest Science, 43: 424-434.
[29] SFR, 2001. Published by Forest Survey of India, Dehradun.
[30] Hairiah, K., Sonya, D., Agus, F., Noordwijk, M.N., and Rahayu, S., 2009. Measuring Carbon
stocks Across Land Use Systems: A Manual. Bogor, Indonesia, World Agro-forestry Center
(ICRAF), SEA Regional Office, Brawijaya University and ICLRRD.
Tables:
Table 1: The sector wise aboveground biomass and belowground biomass of Mangifera indica in
Aurangabad
Sectors No. of Aboveground Belowground
-1 Total Standing
biomass tha -1 -1
tree biomass tha Biomass tha
1 191 2.61 0.68 3.29
2 407 5.57 1.45 7.02
3 394 5.39 1.40 6.79
4 2359 32.31 8.40 40.71
5 497 6.82 1.79 8.61
6 556 7.61 1.98 9.59
7 496 6.79 1.77 8.56
8 604 8.27 2.15 10.42
9 544 7.45 1.94 9.39
Total 6048 82.83 21.54 104.41
45
10. Journal of Environment and Earth Science www.iiste.org
ISSN 2224-3216 (Paper) ISSN 2225-0948 (Online)
Vol 2, No.1, 2012
Table 2: The sector wise aboveground and belowground carbon of Mangifera indica in Aurangabad.
Sectors No. of Aboveground Belowground Total Carbon
-1 -1 -1
tree carbon tha carbon tha sequestered tha
1 191 1.41 0.36 1.77
2 407 3.01 0.78 3.79
3 394 2.91 0.75 3.66
4 2359 17.44 4.53 21.97
5 497 3.65 0.97 4.62
6 556 4.11 1.07 5.18
7 496 3.67 0.95 4.62
8 604 4.46 1.16 5.62
9 544 4.02 1.04 5.06
Total 6048 44.73 11.63 56.36
Table 3: The regression coefficient (a, b and c) for estimate aboveground biomass of Mangifera indica
Diameter class a b c
< 25cm -2.43 0.154 0.193
>25 to <65 cm -26.6 0.614 1.39
>65 cm -115 1.59 3.38
(a = intercept, b & C = regression coefficient, R= regression coefficient)
46
11. Journal of Environment and Earth Science www.iiste.org
ISSN 2224-3216 (Paper) ISSN 2225-0948 (Online)
Vol 2, No.1, 2012
Table 4: Allometry equations based on the regression coefficient to estimate aboveground biomass of
Mangifera indica
2
Diameter class Biomass equations R
< 25cm Biomass(Kg) = - 2.43 + 0.154 D + 0.193 H 95.8 %
>25 to <65 cm Biomass(Kg) = - 26.6 + 0.614 D + 1.39 H 93.8 %
>65 cm Biomass(Kg) = - 115 + 1.59 D + 3.38 H 98.6 %
Figures:
47
12. Journal of Environment and Earth Science www.iiste.org
ISSN 2224-3216 (Paper) ISSN 2225-0948 (Online)
Vol 2, No.1, 2012
Figure 1: Location of study sites in Aurangabad city.
Fig.2: Aboveground carbon (tha-1) of Fig.3: Belowground carbon (tha-1) of
Mangifera
Mangifera indica from 9 sectors of Aurangabad. indica from 9 sectors of Aurangabad.
Fig.4: Total carbon stalk (tha-1) of Mangifera indica from 9 sectors of Aurangabad
48