SlideShare a Scribd company logo
1 of 9
Download to read offline
Mathematical Theory and Modeling www.iiste.org
ISSN 2224-5804 (Paper) ISSN 2225-0522 (Online)
Vol.4, No.4, 2014
114
Studying the Scientific State Of Students Using the Adjusted
Residuals
SAMEERA ABDULSALAM OTHMAN1
, SHELAN SAIED ISMAEEL 2
1. Department of Mathematics, Faculty of Educational Science , School of Basic Education, University of Duhok,
Kurdistan Region-Iraq.
E-mail: samira.a@hotmail.com
2. Department of Mathematics, faculty of science, University of ZAKHO, kurdistan Region-Iraq.
E-mail: sheelansaid@yahoo.com
Abstract
The aim of this article is to apply the adjusted residuals to analysis of (two-way) contingency tables to
determine the cells which affected to the significance of chi-square statistic
Keywords: adjusted residuals, contingency tables ,significance, chi-square
1 - Introduction
We can defined the contingency table by as order rectangles frequency or matrix consist of number of variables
divided by number of level, for example: patients case (bad- middle- good) or (successful case and failure case)
and other of variables. This table may be containing two variables. Each variable divided into numbers of levels
called (contingency table) for two ways on shape matrix (r x c) number of rows (r) denoted levels the first
variable and number of column (c) denoted by number of levels of the second variable when we add the third
variable by (s) by levels into two ways table , the shape of table will change into three ways table, consist of (s)
from two ways tables (r x c), thus when add any variable will change the dimension of table. Generally we called
contingency table for more than two variables by multi- ways. We assume that we have contingency table of two
ways (r x c). The null hypothesis (independent) and Alternative hypothesis dependent as follow:-
Where Pij is a frequency in the cell (i,j)and
i=1,…,r
j=1,2,…,c
For testing hypotheses above we used chi-square test that has the formula as:
…………(1)
Where , are the observed and expected frequencies for cell(i,j) respectively ,and
……………………..(2)
Where , are observed marginal frequencies, n is sum of observed frequency of table.
Mathematical Theory and Modeling www.iiste.org
ISSN 2224-5804 (Paper) ISSN 2225-0522 (Online)
Vol.4, No.4, 2014
115
After calculate the value of ( ) from the formula (1) above we compare it with the tabulated value under
significant level α and degrees of freedom (r-1)(c-1)
2- Definitions:-
Contingency table: data arranged in table form for the chi-square independence test, with r rows and c
columns.
Observed frequency : the actual frequency value obtained from a sample and used in the chi-square test.
Null hypothesis: a statistical hypothesis that states that there is no difference between a parameter and a specific
value or that there is no difference between two parameters.
Alternative hypothesis: a statistical hypothesis that states a difference between a parameter and a specific value
or states that there is a difference between two parameters.
Degrees of freedom: the number of value that is free to vary after a sample statistic has been computed; used
when a distribution (such as the t distribution) consists of a family of curves.
Level of significance: the maximum probability of committing a type I error in hypothesis testing
Independence test: a chi-square test used to test the independence of two variables when data are tabulated in
table form in terms of frequencies.
3-Adjust residuals method:
During the 1978, Haberman suggested method of test after the significant ( ) in contingency table. We can
summarize by the following steps:
-Compute the value of standard error cell (i,j) by following formula:
……………………..(3)
-Compute the value of asymptotic variance as:
……………………………..(4)
-Compute the value of adjusted residual as:
N(0,1)………………………..(5)
We compare the absolute value ( ) with tabulated value for standard normal distribution by level of significant
(0.05) i.e., (1.96), if the value of ( ) is greater than (1.96) it is mean that significant, which means that the
relation between level(i)from first variable and (j) level from second variable is significant, and value ( ) is less
than (1.96) reference to the relation between level of (i) and (j) are insignificant. We can determine the
responsible for the relation between variables are significant.
5-Collection of data
We take the data during the (questionnaire) which is mentioned in the appendix (A) which is distributed the two
college (Basic Education in Duhok and Education in Zakho city), we got (101) form (63 ) females and ( 38 )
males. We grouped the data on the two ways table by using icon (table) in the software of Minitab (13.2) as
show that in the tables below:
Mathematical Theory and Modeling www.iiste.org
ISSN 2224-5804 (Paper) ISSN 2225-0522 (Online)
Vol.4, No.4, 2014
116
Table(1) : relation between level study and sex of each student.
Level of student
Sex
Weak Pass Middle Good Very good total
Male 12 21 21 21 5 63
Female 9 3 5 9 21 38
Total 30 15 22 19 15 101
Table(2) : relation between level study for student and Father’s level education student.
Table(3) : relation between level study for student and Mother’s level education student.
Level of
student
Father’s
level education student
Weak Pass Middle Good Very good total
Ignorance 5 9 5 5 5 29
Primary 3 3 8 6 3 23
Middle 6 1 1 3 1 20
High school 6 1 2 1 1 11
University 21 2 2 3 3 18
Total 30 15 22 19 15 101
Level of
student
Mother’s
level education student
weak Pass Middle Good Very good total
Ignorant 3 21 21 22 1 36
Primary 8 3 8 6 3 28
middle 4 2 1 1 4 11
High school 8 2 2 2 3 14
University 1 2 2 2 2 12
Total 30 17 22 19 13 101
Mathematical Theory and Modeling www.iiste.org
ISSN 2224-5804 (Paper) ISSN 2225-0522 (Online)
Vol.4, No.4, 2014
117
Table(4) : relation between level study for student and economic case for the family.
Level of student
economic
for the family.
weak Pass Middle Good Very
good
total
Weak 6 2 1 5 6 20
Middle 1 9 24 6 4 40
Good 8 1 3 5 3 21
Very good 9 3 3 3 1 20
Total 30 15 22 19 15 101
Table (5): relation between levels studies for student and for student and is mother still life.
Level of student
Mother still life
weak Pass Middle Good Very good total
Yes 11 9 28 25 6 70
No 8 6 4 4 9 31
Total 30 15 22 19 15 101
Table (6): relation between levels studies for student and is father still life.
Level of student
father still life
weak Pass Middle Good Very good total
Yes
14 21 23 24 8
69
No
6 5 9 5 1
32
Total 30 15 22 19 15 101
Table (7) : relation between level study for student and members of the family which student contain.
Level of student
members of the family
weak Pass Middle Good Very good total
1-5 21 3 5 1 4 24
6-10 21 11 7 11 6 56
11 more 21 1 10 5 5 31
Total 30 15 22 19 15 101
Mathematical Theory and Modeling www.iiste.org
ISSN 2224-5804 (Paper) ISSN 2225-0522 (Online)
Vol.4, No.4, 2014
118
Table (8): relation between level study for student and is the student work or not.
Level of student
the student work
weak Pass Middle Good Very good total
Work 21 4 9 6 8 39
not work 21 22 23 14 1 62
Total 29 15 22 20 15 101
6-Analysis of data:
We calculate the ( )values for the tables above to know if there are significant relationships between levels two
variables that have been studied or not, by formula (1) by using (chis) in the software Minitab and that have been
sum marriages in the table (9) below.
Table (9): the chi-square values for the table (1-8)
Tables 1 2 3 4 5 6 7 8
11.049*
26.304*
34.383*
18.006 9.345 4.585 13.145 3.043
9.49 26.296 26.296 21.026 9.49 9.49 15.507 9.49
We note from the above table that the relation between the levels of variables in tables (1), (2), (3) significant.
But the other tables are not significant. Therefore the method is explained in the formulas from (3) to (5) will
apply on these three tables (1-3) only, because we have not special icon to calculate (dij) contain software
program in statistic, we write the program ( 1 ) in appendix (B) by using commands of software Minitab, to
compute it . When we applied in these three tables above we obtained these tables.
Table (10) : the values of Adjust residuals for the table (1).
Level
of
student
Males Female ei. e.j di. dj.
weak 12 9 31 2903169 2106932 1038531 1034511- 10151564 10451411 1016911 3048145-*
pass 21 3 25 906535 503465 1015514 1024244- 10313511 10541985 2031191 1089181*-
middle 21 5 11 2402584 108426 1015528 1043396- 10118196 10513381 2043114 3043155*-
good 21 9 29 2101111 601113 1063111- 1091315- 10189383 10511498 2028411- 2011691-
Very
good
5 21 25 906535 503465 2049113- 1022253 10313511 10541985 1012861*- 1025161
Mathematical Theory and Modeling www.iiste.org
ISSN 2224-5804 (Paper) ISSN 2225-0522 (Online)
Vol.4, No.4, 2014
119
Table (11) : the values of adjust residuals for the table (2).
Level of
student
level
of father
Weak
d1.
Pass
d2.
Middle
d3.
Good
d4.
Very
good
d5.
Ignorant 10512211 10616999 10551591 10518161 10616999 2013941- 1091154* 1011265- 1015632- 10418646
Primary
10541888 10651583 10614158 10616991 10651583 2098961-
*
1011146- 2012881 2012591 10111461-
Middle 10563168 10681814 10611192 10652223 10681814 1013146 1068219- 2059925 1048119- 10682194-
High school 10616419 10158149 10696991 10113458 10158149 2092123 2046134- 2018118- 1015664- 10319142
University 10511688 10699135 10641181 10661289 10699135 1064185* 2011341- 2083985- 1015691- 10138894
Table (12) : the value of adjust residuals for the table (3).
Level of
student
level
of mother
Weak
d1.
Pass
d2.
Middle
d3.
Good
d4.
Very
good
d5.
Ignorant
1045141
1
105351
41
1051338
1
1051149
8
1056111
9
3049112
*-
102882
1*
201863
9
1014149
*
2063388
-
Primary
1051818
1
106122
28
1056533
1
1058681
5
1061914
1
1025423
-
201216
6-
201131
6
1042614 1041191
-
Middle
1061641
9
101422
14
1069699
1
1011345
8
1011639
4
1052124 101169
1-
103164
6-
2069214
-
1046414
*
High school
1061551
9
101264
11
1061315
1
1069934
3
1015152
5
1041192
*
201439
8-
204198
1-
2011315
-
2013121
University
1062944
9
101318
69
1068914
6
1012541
1
1016116
8
1032124
*
101261
8-
201113
1-
1098945
-
1051116
-
Discussion and analysis the results:
1- Although the value significant between the scientific level of the student and his sex, there are four cells
from total ( 10 ) cause cells for significant, all of them from negative direction as the table (10).
2- From the studding special table by relation between levels scientific for student and father education levels, we
noticed there are three of cells responsible for the significant relation between the two variables, we see for
example the father’s education (primary down) there is(1) from cell responsible for significant. There is one cell
their effected to minuses direct there are reaction this level from father’s education with the level (pass) from
student scientific level. This is also agree with scientific logical (notice table 11).
3- We notice through the table (12) the cells (or the reaction between the levels of student scientific level and the
mother’s scientific levels) that responsible for the relation significant between these two variables is more
compare with the number of significant reaction between the levels student scientific level, and father’s
education levels and this mean the student scientific level the effective is more by mother’s education level from
father’s education level.
Through the results from these searches from scientific application results to use straighten reminder method in
table analysis. The researcher that is very important make this test and don’t desisting from significant ).
References
Agresti, A, Lipstiz and LANG, J.B. (1992), Comparing marginal distributions Large, sparse tables,
Computational Statistics and Data Analysis, 14, 55, 73.
Agresti, A, Liu, I. (1999), Modeling a categorical variable allowing arbitrarily Category choices Submitted to
Biometrics.
Bishop, Y.M.M, Fienberg, S.Y. and Holland, P.W. (1975), Discrete
Mathematical Theory and Modeling www.iiste.org
ISSN 2224-5804 (Paper) ISSN 2225-0522 (Online)
Vol.4, No.4, 2014
120
Multivariate Analysis: Theory and Practice', the MIT Press Cambridge Massachusetts and London.
Everitt, B.S. (1977), The Analysis of Contingency Tables, Chapin and Hall Ltd., London.
Haberman,S.J. (1978), Analysis of qualitative data vol. 1, Academic Press INC, London.
Appendix(A):
The (questionnaire) which affected the level study of student:
1. sex of student: Male female
2. Father’s level education student : ignorance Primary Middle High school University
3. Mother’s level education student : ignorance Primary Middle High school University
4. economic case: Weak Middle Good very good
5. is father still life: yes no
6. is mother still life: yes no
7. number individual family:
8. is student have the work : yes no
9. level of the student: Weak pass Middle Good very good
Appendix (B)
The software Minitab(13.2) is used in the following macro programs.
Program(1):
gmacro
aa.macro
let k1=101
let k3= sum( c1)
Mathematical Theory and Modeling www.iiste.org
ISSN 2224-5804 (Paper) ISSN 2225-0522 (Online)
Vol.4, No.4, 2014
121
let k4= sum( c2)
print k3,k4
do k2=1:5
let c3(k2)=c1(k2)+c2(k2)
let c4(k2)= k3*c3(k2)/k1
let c5(k2)= k4*c3(k2)/k1
let c6(k2)= (c1(k2) -c4(k2))/(c4(k2)**0.5)
let c7(k2)=(c2(k2)-c4(k2))/(c4(k2)**0.5)
let c8(k2)= (1-k3/k1)*(1-c3(k2)/k1)
let c9(k2)=(1-k4/k1)*(1-c3(k2)/k1)
let c10(k2)= c6(k2)/c8(k2)**0.5
let c11(k2)=c7(k2)/c9(k2)**0.5
enddo
endmacro
program(2):
gmacro
aa.macro
let k1=101
let k3= sum( c1)
let k4= sum( c2)
let k5=sum(c3)
let k6=sum(c4)
let k7=sum(c5)
print k3,k4,k5,k6,k7
do k2=1:5
let c6(k2)=c1(k2)+c2(k2)+c3(k2)+c4(k2)+c5(k2)
let c7(k2)= k3*c6(k2)/k1
let c8(k2)= k4*c6(k2)/k1
let c9(k2)= k5*c6(k2)/k1
let c10(k2)=k6*c6(k2)/k1
let c11(k2)=k7*c6(k2)/k1
let c12(k2)= (c1(k2) -c7(k2))/(c7(k2)**0.5)
let c13(k2)=(c2(k2)-c8(k2))/(c8(k2)**0.5)
let c14(k2)=(c3(k2)-c9(k2))/(c9(k2)**0.5)
Mathematical Theory and Modeling www.iiste.org
ISSN 2224-5804 (Paper) ISSN 2225-0522 (Online)
Vol.4, No.4, 2014
122
let c15(k2)=(c4(k2)-c10(k2))/(c10(k2)**0.5)
let c16(k2)=(c5(k2)-c11(k2))/(c11(k2)**0.5)
let c17(k2)= (1-k3/k1)*(1-c6(k2)/k1)
let c18(k2)=(1-k4/k1)*(1-c6(k2)/k1)
let c19(k2)=(1-k5/k1)*(1-c6(k2)/k1)
let c20(k2)=(1-k6/k1)*(1-c6(k2)/k1)
let c21(k2)=(1-k7/k1)*(1-c6(k2)/k1)
let c22(k2)=c12(k2)/c17(k2)**0.5
let c23(k2)=c13(k2)/c18(k2)**0.5
let c24(k2)=c14(k2)/c19(k2)**0.5
let c25(k2)=c15(k2)/c20(k2)**0.5
let c26(k2)=c16(k2)/c21(k2)**0.5
enddo
endmacro

More Related Content

What's hot

2. week 2 data presentation and organization
2. week 2 data presentation and organization2. week 2 data presentation and organization
2. week 2 data presentation and organizationrenz50
 
Splay Method of Model Acquisition Assessment
Splay Method of Model Acquisition AssessmentSplay Method of Model Acquisition Assessment
Splay Method of Model Acquisition Assessmentijtsrd
 
Thiyagu measures of central tendency final
Thiyagu   measures of central tendency finalThiyagu   measures of central tendency final
Thiyagu measures of central tendency finalThiyagu K
 
UKMTLC 2013_6_2015_2_091_097
UKMTLC 2013_6_2015_2_091_097UKMTLC 2013_6_2015_2_091_097
UKMTLC 2013_6_2015_2_091_097Puteri Sarah Diba
 
Integrating Fuzzy Dematel and SMAA-2 for Maintenance Expenses
Integrating Fuzzy Dematel and SMAA-2 for Maintenance ExpensesIntegrating Fuzzy Dematel and SMAA-2 for Maintenance Expenses
Integrating Fuzzy Dematel and SMAA-2 for Maintenance Expensesinventionjournals
 
Assessment of Learning 1: Chapter 5 - Utilization of Assessment Data
Assessment of Learning 1: Chapter 5 - Utilization of Assessment DataAssessment of Learning 1: Chapter 5 - Utilization of Assessment Data
Assessment of Learning 1: Chapter 5 - Utilization of Assessment DataDonna Domulot
 
Take+to+the+test.97 186
Take+to+the+test.97 186Take+to+the+test.97 186
Take+to+the+test.97 186Kerta Yasa
 
Teaching Mathematics Based On “Mathematization” Of Theory of Realistic Mathem...
Teaching Mathematics Based On “Mathematization” Of Theory of Realistic Mathem...Teaching Mathematics Based On “Mathematization” Of Theory of Realistic Mathem...
Teaching Mathematics Based On “Mathematization” Of Theory of Realistic Mathem...theijes
 
lesson 4 measures of central tendency copy
lesson 4 measures of central tendency   copylesson 4 measures of central tendency   copy
lesson 4 measures of central tendency copyNerz Baldres
 
Percentiles and Deciles
Percentiles and DecilesPercentiles and Deciles
Percentiles and DecilesMary Espinar
 
Measures of Variability of Grouped and Ungrouped Data
Measures of Variability of Grouped and Ungrouped DataMeasures of Variability of Grouped and Ungrouped Data
Measures of Variability of Grouped and Ungrouped DataJunila Tejada
 
Effect of elements on linear elastic stress analysis
Effect of elements on linear elastic stress analysisEffect of elements on linear elastic stress analysis
Effect of elements on linear elastic stress analysiseSAT Journals
 

What's hot (17)

2. week 2 data presentation and organization
2. week 2 data presentation and organization2. week 2 data presentation and organization
2. week 2 data presentation and organization
 
Splay Method of Model Acquisition Assessment
Splay Method of Model Acquisition AssessmentSplay Method of Model Acquisition Assessment
Splay Method of Model Acquisition Assessment
 
Thiyagu measures of central tendency final
Thiyagu   measures of central tendency finalThiyagu   measures of central tendency final
Thiyagu measures of central tendency final
 
50120140505001
5012014050500150120140505001
50120140505001
 
UKMTLC 2013_6_2015_2_091_097
UKMTLC 2013_6_2015_2_091_097UKMTLC 2013_6_2015_2_091_097
UKMTLC 2013_6_2015_2_091_097
 
Integrating Fuzzy Dematel and SMAA-2 for Maintenance Expenses
Integrating Fuzzy Dematel and SMAA-2 for Maintenance ExpensesIntegrating Fuzzy Dematel and SMAA-2 for Maintenance Expenses
Integrating Fuzzy Dematel and SMAA-2 for Maintenance Expenses
 
Assessment of Learning 1: Chapter 5 - Utilization of Assessment Data
Assessment of Learning 1: Chapter 5 - Utilization of Assessment DataAssessment of Learning 1: Chapter 5 - Utilization of Assessment Data
Assessment of Learning 1: Chapter 5 - Utilization of Assessment Data
 
Take+to+the+test.97 186
Take+to+the+test.97 186Take+to+the+test.97 186
Take+to+the+test.97 186
 
Teaching Mathematics Based On “Mathematization” Of Theory of Realistic Mathem...
Teaching Mathematics Based On “Mathematization” Of Theory of Realistic Mathem...Teaching Mathematics Based On “Mathematization” Of Theory of Realistic Mathem...
Teaching Mathematics Based On “Mathematization” Of Theory of Realistic Mathem...
 
lesson 4 measures of central tendency copy
lesson 4 measures of central tendency   copylesson 4 measures of central tendency   copy
lesson 4 measures of central tendency copy
 
5th Grade Math Glossary
5th Grade Math Glossary5th Grade Math Glossary
5th Grade Math Glossary
 
Anova advanced
Anova advancedAnova advanced
Anova advanced
 
Percentiles and Deciles
Percentiles and DecilesPercentiles and Deciles
Percentiles and Deciles
 
Measures of Variability of Grouped and Ungrouped Data
Measures of Variability of Grouped and Ungrouped DataMeasures of Variability of Grouped and Ungrouped Data
Measures of Variability of Grouped and Ungrouped Data
 
3rd Grade Glossary
3rd Grade Glossary3rd Grade Glossary
3rd Grade Glossary
 
4th Grade Glossary
4th Grade Glossary4th Grade Glossary
4th Grade Glossary
 
Effect of elements on linear elastic stress analysis
Effect of elements on linear elastic stress analysisEffect of elements on linear elastic stress analysis
Effect of elements on linear elastic stress analysis
 

Similar to Studying the scientific state of students using the adjusted residuals

501 assignment1
501 assignment1501 assignment1
501 assignment1Wa Ain
 
6Categorical data analysis presentation.pdf
6Categorical data analysis presentation.pdf6Categorical data analysis presentation.pdf
6Categorical data analysis presentation.pdfMitikuTeka1
 
Correlation: Bivariate Data and Scatter Plot
Correlation: Bivariate Data and Scatter PlotCorrelation: Bivariate Data and Scatter Plot
Correlation: Bivariate Data and Scatter PlotDenzelMontuya1
 
Analyzing experimental research data
Analyzing experimental research dataAnalyzing experimental research data
Analyzing experimental research dataAtula Ahuja
 
A note on estimation of population mean in sample survey using auxiliary info...
A note on estimation of population mean in sample survey using auxiliary info...A note on estimation of population mean in sample survey using auxiliary info...
A note on estimation of population mean in sample survey using auxiliary info...Alexander Decker
 
Parametric Sensitivity Analysis of a Mathematical Model of Two Interacting Po...
Parametric Sensitivity Analysis of a Mathematical Model of Two Interacting Po...Parametric Sensitivity Analysis of a Mathematical Model of Two Interacting Po...
Parametric Sensitivity Analysis of a Mathematical Model of Two Interacting Po...IOSR Journals
 
8 a math summer packet (hadzovic)
8 a math summer packet (hadzovic)8 a math summer packet (hadzovic)
8 a math summer packet (hadzovic)Frances O'Neill
 
8 a math summer packet (hadzovic)
8 a math summer packet (hadzovic)8 a math summer packet (hadzovic)
8 a math summer packet (hadzovic)Frances O'Neill
 
Measures of Spread Revision
Measures of Spread Revision Measures of Spread Revision
Measures of Spread Revision Puna Ripiye
 
Measures of spread revision
Measures of spread revision Measures of spread revision
Measures of spread revision Puna Ripiye
 
In the t test for independent groups, ____.we estimate µ1 µ2.docx
In the t test for independent groups, ____.we estimate µ1 µ2.docxIn the t test for independent groups, ____.we estimate µ1 µ2.docx
In the t test for independent groups, ____.we estimate µ1 µ2.docxbradburgess22840
 
Chapter Two PPT Lecture - Part One.ppt
Chapter Two PPT Lecture - Part One.pptChapter Two PPT Lecture - Part One.ppt
Chapter Two PPT Lecture - Part One.pptjosh658552
 
IRJET- Analysis of Chi-Square Independence Test for Naïve Bayes Feature Selec...
IRJET- Analysis of Chi-Square Independence Test for Naïve Bayes Feature Selec...IRJET- Analysis of Chi-Square Independence Test for Naïve Bayes Feature Selec...
IRJET- Analysis of Chi-Square Independence Test for Naïve Bayes Feature Selec...IRJET Journal
 
RESIDUALS AND INFLUENCE IN NONLINEAR REGRESSION FOR REPEATED MEASUREMENT DATA
RESIDUALS AND INFLUENCE IN NONLINEAR REGRESSION FOR REPEATED MEASUREMENT DATARESIDUALS AND INFLUENCE IN NONLINEAR REGRESSION FOR REPEATED MEASUREMENT DATA
RESIDUALS AND INFLUENCE IN NONLINEAR REGRESSION FOR REPEATED MEASUREMENT DATAorajjournal
 
Lesson 1 06 using the mean to measure central tendency
Lesson 1 06 using the mean to measure central tendency Lesson 1 06 using the mean to measure central tendency
Lesson 1 06 using the mean to measure central tendency Perla Pelicano Corpez
 
Eigenvalues for HIV-1 dynamic model with two delays
Eigenvalues for HIV-1 dynamic model with two delaysEigenvalues for HIV-1 dynamic model with two delays
Eigenvalues for HIV-1 dynamic model with two delaysIOSR Journals
 

Similar to Studying the scientific state of students using the adjusted residuals (20)

W1002 MATHS ASSIGNMENT, BBA
W1002 MATHS ASSIGNMENT, BBAW1002 MATHS ASSIGNMENT, BBA
W1002 MATHS ASSIGNMENT, BBA
 
501 assignment1
501 assignment1501 assignment1
501 assignment1
 
6Categorical data analysis presentation.pdf
6Categorical data analysis presentation.pdf6Categorical data analysis presentation.pdf
6Categorical data analysis presentation.pdf
 
Correlation: Bivariate Data and Scatter Plot
Correlation: Bivariate Data and Scatter PlotCorrelation: Bivariate Data and Scatter Plot
Correlation: Bivariate Data and Scatter Plot
 
Analyzing experimental research data
Analyzing experimental research dataAnalyzing experimental research data
Analyzing experimental research data
 
Presentation2 bucks-1
Presentation2 bucks-1Presentation2 bucks-1
Presentation2 bucks-1
 
A note on estimation of population mean in sample survey using auxiliary info...
A note on estimation of population mean in sample survey using auxiliary info...A note on estimation of population mean in sample survey using auxiliary info...
A note on estimation of population mean in sample survey using auxiliary info...
 
Anova statistics
Anova statisticsAnova statistics
Anova statistics
 
Parametric Sensitivity Analysis of a Mathematical Model of Two Interacting Po...
Parametric Sensitivity Analysis of a Mathematical Model of Two Interacting Po...Parametric Sensitivity Analysis of a Mathematical Model of Two Interacting Po...
Parametric Sensitivity Analysis of a Mathematical Model of Two Interacting Po...
 
8 a math summer packet (hadzovic)
8 a math summer packet (hadzovic)8 a math summer packet (hadzovic)
8 a math summer packet (hadzovic)
 
8 a math summer packet (hadzovic)
8 a math summer packet (hadzovic)8 a math summer packet (hadzovic)
8 a math summer packet (hadzovic)
 
Measures of Spread Revision
Measures of Spread Revision Measures of Spread Revision
Measures of Spread Revision
 
Measures of spread revision
Measures of spread revision Measures of spread revision
Measures of spread revision
 
In the t test for independent groups, ____.we estimate µ1 µ2.docx
In the t test for independent groups, ____.we estimate µ1 µ2.docxIn the t test for independent groups, ____.we estimate µ1 µ2.docx
In the t test for independent groups, ____.we estimate µ1 µ2.docx
 
Chapter Two PPT Lecture - Part One.ppt
Chapter Two PPT Lecture - Part One.pptChapter Two PPT Lecture - Part One.ppt
Chapter Two PPT Lecture - Part One.ppt
 
IRJET- Analysis of Chi-Square Independence Test for Naïve Bayes Feature Selec...
IRJET- Analysis of Chi-Square Independence Test for Naïve Bayes Feature Selec...IRJET- Analysis of Chi-Square Independence Test for Naïve Bayes Feature Selec...
IRJET- Analysis of Chi-Square Independence Test for Naïve Bayes Feature Selec...
 
RESIDUALS AND INFLUENCE IN NONLINEAR REGRESSION FOR REPEATED MEASUREMENT DATA
RESIDUALS AND INFLUENCE IN NONLINEAR REGRESSION FOR REPEATED MEASUREMENT DATARESIDUALS AND INFLUENCE IN NONLINEAR REGRESSION FOR REPEATED MEASUREMENT DATA
RESIDUALS AND INFLUENCE IN NONLINEAR REGRESSION FOR REPEATED MEASUREMENT DATA
 
Lesson 1 06 using the mean to measure central tendency
Lesson 1 06 using the mean to measure central tendency Lesson 1 06 using the mean to measure central tendency
Lesson 1 06 using the mean to measure central tendency
 
Correlation.pptx
Correlation.pptxCorrelation.pptx
Correlation.pptx
 
Eigenvalues for HIV-1 dynamic model with two delays
Eigenvalues for HIV-1 dynamic model with two delaysEigenvalues for HIV-1 dynamic model with two delays
Eigenvalues for HIV-1 dynamic model with two delays
 

More from Alexander Decker

Abnormalities of hormones and inflammatory cytokines in women affected with p...
Abnormalities of hormones and inflammatory cytokines in women affected with p...Abnormalities of hormones and inflammatory cytokines in women affected with p...
Abnormalities of hormones and inflammatory cytokines in women affected with p...Alexander Decker
 
A validation of the adverse childhood experiences scale in
A validation of the adverse childhood experiences scale inA validation of the adverse childhood experiences scale in
A validation of the adverse childhood experiences scale inAlexander Decker
 
A usability evaluation framework for b2 c e commerce websites
A usability evaluation framework for b2 c e commerce websitesA usability evaluation framework for b2 c e commerce websites
A usability evaluation framework for b2 c e commerce websitesAlexander Decker
 
A universal model for managing the marketing executives in nigerian banks
A universal model for managing the marketing executives in nigerian banksA universal model for managing the marketing executives in nigerian banks
A universal model for managing the marketing executives in nigerian banksAlexander Decker
 
A unique common fixed point theorems in generalized d
A unique common fixed point theorems in generalized dA unique common fixed point theorems in generalized d
A unique common fixed point theorems in generalized dAlexander Decker
 
A trends of salmonella and antibiotic resistance
A trends of salmonella and antibiotic resistanceA trends of salmonella and antibiotic resistance
A trends of salmonella and antibiotic resistanceAlexander Decker
 
A transformational generative approach towards understanding al-istifham
A transformational  generative approach towards understanding al-istifhamA transformational  generative approach towards understanding al-istifham
A transformational generative approach towards understanding al-istifhamAlexander Decker
 
A time series analysis of the determinants of savings in namibia
A time series analysis of the determinants of savings in namibiaA time series analysis of the determinants of savings in namibia
A time series analysis of the determinants of savings in namibiaAlexander Decker
 
A therapy for physical and mental fitness of school children
A therapy for physical and mental fitness of school childrenA therapy for physical and mental fitness of school children
A therapy for physical and mental fitness of school childrenAlexander Decker
 
A theory of efficiency for managing the marketing executives in nigerian banks
A theory of efficiency for managing the marketing executives in nigerian banksA theory of efficiency for managing the marketing executives in nigerian banks
A theory of efficiency for managing the marketing executives in nigerian banksAlexander Decker
 
A systematic evaluation of link budget for
A systematic evaluation of link budget forA systematic evaluation of link budget for
A systematic evaluation of link budget forAlexander Decker
 
A synthetic review of contraceptive supplies in punjab
A synthetic review of contraceptive supplies in punjabA synthetic review of contraceptive supplies in punjab
A synthetic review of contraceptive supplies in punjabAlexander Decker
 
A synthesis of taylor’s and fayol’s management approaches for managing market...
A synthesis of taylor’s and fayol’s management approaches for managing market...A synthesis of taylor’s and fayol’s management approaches for managing market...
A synthesis of taylor’s and fayol’s management approaches for managing market...Alexander Decker
 
A survey paper on sequence pattern mining with incremental
A survey paper on sequence pattern mining with incrementalA survey paper on sequence pattern mining with incremental
A survey paper on sequence pattern mining with incrementalAlexander Decker
 
A survey on live virtual machine migrations and its techniques
A survey on live virtual machine migrations and its techniquesA survey on live virtual machine migrations and its techniques
A survey on live virtual machine migrations and its techniquesAlexander Decker
 
A survey on data mining and analysis in hadoop and mongo db
A survey on data mining and analysis in hadoop and mongo dbA survey on data mining and analysis in hadoop and mongo db
A survey on data mining and analysis in hadoop and mongo dbAlexander Decker
 
A survey on challenges to the media cloud
A survey on challenges to the media cloudA survey on challenges to the media cloud
A survey on challenges to the media cloudAlexander Decker
 
A survey of provenance leveraged
A survey of provenance leveragedA survey of provenance leveraged
A survey of provenance leveragedAlexander Decker
 
A survey of private equity investments in kenya
A survey of private equity investments in kenyaA survey of private equity investments in kenya
A survey of private equity investments in kenyaAlexander Decker
 
A study to measures the financial health of
A study to measures the financial health ofA study to measures the financial health of
A study to measures the financial health ofAlexander Decker
 

More from Alexander Decker (20)

Abnormalities of hormones and inflammatory cytokines in women affected with p...
Abnormalities of hormones and inflammatory cytokines in women affected with p...Abnormalities of hormones and inflammatory cytokines in women affected with p...
Abnormalities of hormones and inflammatory cytokines in women affected with p...
 
A validation of the adverse childhood experiences scale in
A validation of the adverse childhood experiences scale inA validation of the adverse childhood experiences scale in
A validation of the adverse childhood experiences scale in
 
A usability evaluation framework for b2 c e commerce websites
A usability evaluation framework for b2 c e commerce websitesA usability evaluation framework for b2 c e commerce websites
A usability evaluation framework for b2 c e commerce websites
 
A universal model for managing the marketing executives in nigerian banks
A universal model for managing the marketing executives in nigerian banksA universal model for managing the marketing executives in nigerian banks
A universal model for managing the marketing executives in nigerian banks
 
A unique common fixed point theorems in generalized d
A unique common fixed point theorems in generalized dA unique common fixed point theorems in generalized d
A unique common fixed point theorems in generalized d
 
A trends of salmonella and antibiotic resistance
A trends of salmonella and antibiotic resistanceA trends of salmonella and antibiotic resistance
A trends of salmonella and antibiotic resistance
 
A transformational generative approach towards understanding al-istifham
A transformational  generative approach towards understanding al-istifhamA transformational  generative approach towards understanding al-istifham
A transformational generative approach towards understanding al-istifham
 
A time series analysis of the determinants of savings in namibia
A time series analysis of the determinants of savings in namibiaA time series analysis of the determinants of savings in namibia
A time series analysis of the determinants of savings in namibia
 
A therapy for physical and mental fitness of school children
A therapy for physical and mental fitness of school childrenA therapy for physical and mental fitness of school children
A therapy for physical and mental fitness of school children
 
A theory of efficiency for managing the marketing executives in nigerian banks
A theory of efficiency for managing the marketing executives in nigerian banksA theory of efficiency for managing the marketing executives in nigerian banks
A theory of efficiency for managing the marketing executives in nigerian banks
 
A systematic evaluation of link budget for
A systematic evaluation of link budget forA systematic evaluation of link budget for
A systematic evaluation of link budget for
 
A synthetic review of contraceptive supplies in punjab
A synthetic review of contraceptive supplies in punjabA synthetic review of contraceptive supplies in punjab
A synthetic review of contraceptive supplies in punjab
 
A synthesis of taylor’s and fayol’s management approaches for managing market...
A synthesis of taylor’s and fayol’s management approaches for managing market...A synthesis of taylor’s and fayol’s management approaches for managing market...
A synthesis of taylor’s and fayol’s management approaches for managing market...
 
A survey paper on sequence pattern mining with incremental
A survey paper on sequence pattern mining with incrementalA survey paper on sequence pattern mining with incremental
A survey paper on sequence pattern mining with incremental
 
A survey on live virtual machine migrations and its techniques
A survey on live virtual machine migrations and its techniquesA survey on live virtual machine migrations and its techniques
A survey on live virtual machine migrations and its techniques
 
A survey on data mining and analysis in hadoop and mongo db
A survey on data mining and analysis in hadoop and mongo dbA survey on data mining and analysis in hadoop and mongo db
A survey on data mining and analysis in hadoop and mongo db
 
A survey on challenges to the media cloud
A survey on challenges to the media cloudA survey on challenges to the media cloud
A survey on challenges to the media cloud
 
A survey of provenance leveraged
A survey of provenance leveragedA survey of provenance leveraged
A survey of provenance leveraged
 
A survey of private equity investments in kenya
A survey of private equity investments in kenyaA survey of private equity investments in kenya
A survey of private equity investments in kenya
 
A study to measures the financial health of
A study to measures the financial health ofA study to measures the financial health of
A study to measures the financial health of
 

Recently uploaded

NSX-T and Service Interfaces presentation
NSX-T and Service Interfaces presentationNSX-T and Service Interfaces presentation
NSX-T and Service Interfaces presentationMarko4394
 
Magic exist by Marta Loveguard - presentation.pptx
Magic exist by Marta Loveguard - presentation.pptxMagic exist by Marta Loveguard - presentation.pptx
Magic exist by Marta Loveguard - presentation.pptxMartaLoveguard
 
办理多伦多大学毕业证成绩单|购买加拿大UTSG文凭证书
办理多伦多大学毕业证成绩单|购买加拿大UTSG文凭证书办理多伦多大学毕业证成绩单|购买加拿大UTSG文凭证书
办理多伦多大学毕业证成绩单|购买加拿大UTSG文凭证书zdzoqco
 
Top 10 Interactive Website Design Trends in 2024.pptx
Top 10 Interactive Website Design Trends in 2024.pptxTop 10 Interactive Website Design Trends in 2024.pptx
Top 10 Interactive Website Design Trends in 2024.pptxDyna Gilbert
 
SCM Symposium PPT Format Customer loyalty is predi
SCM Symposium PPT Format Customer loyalty is prediSCM Symposium PPT Format Customer loyalty is predi
SCM Symposium PPT Format Customer loyalty is predieusebiomeyer
 
『澳洲文凭』买詹姆士库克大学毕业证书成绩单办理澳洲JCU文凭学位证书
『澳洲文凭』买詹姆士库克大学毕业证书成绩单办理澳洲JCU文凭学位证书『澳洲文凭』买詹姆士库克大学毕业证书成绩单办理澳洲JCU文凭学位证书
『澳洲文凭』买詹姆士库克大学毕业证书成绩单办理澳洲JCU文凭学位证书rnrncn29
 
Call Girls Near The Suryaa Hotel New Delhi 9873777170
Call Girls Near The Suryaa Hotel New Delhi 9873777170Call Girls Near The Suryaa Hotel New Delhi 9873777170
Call Girls Near The Suryaa Hotel New Delhi 9873777170Sonam Pathan
 
定制(Lincoln毕业证书)新西兰林肯大学毕业证成绩单原版一比一
定制(Lincoln毕业证书)新西兰林肯大学毕业证成绩单原版一比一定制(Lincoln毕业证书)新西兰林肯大学毕业证成绩单原版一比一
定制(Lincoln毕业证书)新西兰林肯大学毕业证成绩单原版一比一Fs
 
Git and Github workshop GDSC MLRITM
Git and Github  workshop GDSC MLRITMGit and Github  workshop GDSC MLRITM
Git and Github workshop GDSC MLRITMgdsc13
 
定制(Management毕业证书)新加坡管理大学毕业证成绩单原版一比一
定制(Management毕业证书)新加坡管理大学毕业证成绩单原版一比一定制(Management毕业证书)新加坡管理大学毕业证成绩单原版一比一
定制(Management毕业证书)新加坡管理大学毕业证成绩单原版一比一Fs
 
Font Performance - NYC WebPerf Meetup April '24
Font Performance - NYC WebPerf Meetup April '24Font Performance - NYC WebPerf Meetup April '24
Font Performance - NYC WebPerf Meetup April '24Paul Calvano
 
Film cover research (1).pptxsdasdasdasdasdasa
Film cover research (1).pptxsdasdasdasdasdasaFilm cover research (1).pptxsdasdasdasdasdasa
Film cover research (1).pptxsdasdasdasdasdasa494f574xmv
 
Elevate Your Business with Our IT Expertise in New Orleans
Elevate Your Business with Our IT Expertise in New OrleansElevate Your Business with Our IT Expertise in New Orleans
Elevate Your Business with Our IT Expertise in New Orleanscorenetworkseo
 
Q4-1-Illustrating-Hypothesis-Testing.pptx
Q4-1-Illustrating-Hypothesis-Testing.pptxQ4-1-Illustrating-Hypothesis-Testing.pptx
Q4-1-Illustrating-Hypothesis-Testing.pptxeditsforyah
 
PHP-based rendering of TYPO3 Documentation
PHP-based rendering of TYPO3 DocumentationPHP-based rendering of TYPO3 Documentation
PHP-based rendering of TYPO3 DocumentationLinaWolf1
 
Contact Rya Baby for Call Girls New Delhi
Contact Rya Baby for Call Girls New DelhiContact Rya Baby for Call Girls New Delhi
Contact Rya Baby for Call Girls New Delhimiss dipika
 
『澳洲文凭』买拉筹伯大学毕业证书成绩单办理澳洲LTU文凭学位证书
『澳洲文凭』买拉筹伯大学毕业证书成绩单办理澳洲LTU文凭学位证书『澳洲文凭』买拉筹伯大学毕业证书成绩单办理澳洲LTU文凭学位证书
『澳洲文凭』买拉筹伯大学毕业证书成绩单办理澳洲LTU文凭学位证书rnrncn29
 
办理(UofR毕业证书)罗切斯特大学毕业证成绩单原版一比一
办理(UofR毕业证书)罗切斯特大学毕业证成绩单原版一比一办理(UofR毕业证书)罗切斯特大学毕业证成绩单原版一比一
办理(UofR毕业证书)罗切斯特大学毕业证成绩单原版一比一z xss
 
Potsdam FH学位证,波茨坦应用技术大学毕业证书1:1制作
Potsdam FH学位证,波茨坦应用技术大学毕业证书1:1制作Potsdam FH学位证,波茨坦应用技术大学毕业证书1:1制作
Potsdam FH学位证,波茨坦应用技术大学毕业证书1:1制作ys8omjxb
 

Recently uploaded (20)

NSX-T and Service Interfaces presentation
NSX-T and Service Interfaces presentationNSX-T and Service Interfaces presentation
NSX-T and Service Interfaces presentation
 
Magic exist by Marta Loveguard - presentation.pptx
Magic exist by Marta Loveguard - presentation.pptxMagic exist by Marta Loveguard - presentation.pptx
Magic exist by Marta Loveguard - presentation.pptx
 
办理多伦多大学毕业证成绩单|购买加拿大UTSG文凭证书
办理多伦多大学毕业证成绩单|购买加拿大UTSG文凭证书办理多伦多大学毕业证成绩单|购买加拿大UTSG文凭证书
办理多伦多大学毕业证成绩单|购买加拿大UTSG文凭证书
 
Top 10 Interactive Website Design Trends in 2024.pptx
Top 10 Interactive Website Design Trends in 2024.pptxTop 10 Interactive Website Design Trends in 2024.pptx
Top 10 Interactive Website Design Trends in 2024.pptx
 
SCM Symposium PPT Format Customer loyalty is predi
SCM Symposium PPT Format Customer loyalty is prediSCM Symposium PPT Format Customer loyalty is predi
SCM Symposium PPT Format Customer loyalty is predi
 
『澳洲文凭』买詹姆士库克大学毕业证书成绩单办理澳洲JCU文凭学位证书
『澳洲文凭』买詹姆士库克大学毕业证书成绩单办理澳洲JCU文凭学位证书『澳洲文凭』买詹姆士库克大学毕业证书成绩单办理澳洲JCU文凭学位证书
『澳洲文凭』买詹姆士库克大学毕业证书成绩单办理澳洲JCU文凭学位证书
 
Call Girls Near The Suryaa Hotel New Delhi 9873777170
Call Girls Near The Suryaa Hotel New Delhi 9873777170Call Girls Near The Suryaa Hotel New Delhi 9873777170
Call Girls Near The Suryaa Hotel New Delhi 9873777170
 
定制(Lincoln毕业证书)新西兰林肯大学毕业证成绩单原版一比一
定制(Lincoln毕业证书)新西兰林肯大学毕业证成绩单原版一比一定制(Lincoln毕业证书)新西兰林肯大学毕业证成绩单原版一比一
定制(Lincoln毕业证书)新西兰林肯大学毕业证成绩单原版一比一
 
Git and Github workshop GDSC MLRITM
Git and Github  workshop GDSC MLRITMGit and Github  workshop GDSC MLRITM
Git and Github workshop GDSC MLRITM
 
定制(Management毕业证书)新加坡管理大学毕业证成绩单原版一比一
定制(Management毕业证书)新加坡管理大学毕业证成绩单原版一比一定制(Management毕业证书)新加坡管理大学毕业证成绩单原版一比一
定制(Management毕业证书)新加坡管理大学毕业证成绩单原版一比一
 
Font Performance - NYC WebPerf Meetup April '24
Font Performance - NYC WebPerf Meetup April '24Font Performance - NYC WebPerf Meetup April '24
Font Performance - NYC WebPerf Meetup April '24
 
Film cover research (1).pptxsdasdasdasdasdasa
Film cover research (1).pptxsdasdasdasdasdasaFilm cover research (1).pptxsdasdasdasdasdasa
Film cover research (1).pptxsdasdasdasdasdasa
 
Elevate Your Business with Our IT Expertise in New Orleans
Elevate Your Business with Our IT Expertise in New OrleansElevate Your Business with Our IT Expertise in New Orleans
Elevate Your Business with Our IT Expertise in New Orleans
 
Q4-1-Illustrating-Hypothesis-Testing.pptx
Q4-1-Illustrating-Hypothesis-Testing.pptxQ4-1-Illustrating-Hypothesis-Testing.pptx
Q4-1-Illustrating-Hypothesis-Testing.pptx
 
PHP-based rendering of TYPO3 Documentation
PHP-based rendering of TYPO3 DocumentationPHP-based rendering of TYPO3 Documentation
PHP-based rendering of TYPO3 Documentation
 
Contact Rya Baby for Call Girls New Delhi
Contact Rya Baby for Call Girls New DelhiContact Rya Baby for Call Girls New Delhi
Contact Rya Baby for Call Girls New Delhi
 
『澳洲文凭』买拉筹伯大学毕业证书成绩单办理澳洲LTU文凭学位证书
『澳洲文凭』买拉筹伯大学毕业证书成绩单办理澳洲LTU文凭学位证书『澳洲文凭』买拉筹伯大学毕业证书成绩单办理澳洲LTU文凭学位证书
『澳洲文凭』买拉筹伯大学毕业证书成绩单办理澳洲LTU文凭学位证书
 
Hot Sexy call girls in Rk Puram 🔝 9953056974 🔝 Delhi escort Service
Hot Sexy call girls in  Rk Puram 🔝 9953056974 🔝 Delhi escort ServiceHot Sexy call girls in  Rk Puram 🔝 9953056974 🔝 Delhi escort Service
Hot Sexy call girls in Rk Puram 🔝 9953056974 🔝 Delhi escort Service
 
办理(UofR毕业证书)罗切斯特大学毕业证成绩单原版一比一
办理(UofR毕业证书)罗切斯特大学毕业证成绩单原版一比一办理(UofR毕业证书)罗切斯特大学毕业证成绩单原版一比一
办理(UofR毕业证书)罗切斯特大学毕业证成绩单原版一比一
 
Potsdam FH学位证,波茨坦应用技术大学毕业证书1:1制作
Potsdam FH学位证,波茨坦应用技术大学毕业证书1:1制作Potsdam FH学位证,波茨坦应用技术大学毕业证书1:1制作
Potsdam FH学位证,波茨坦应用技术大学毕业证书1:1制作
 

Studying the scientific state of students using the adjusted residuals

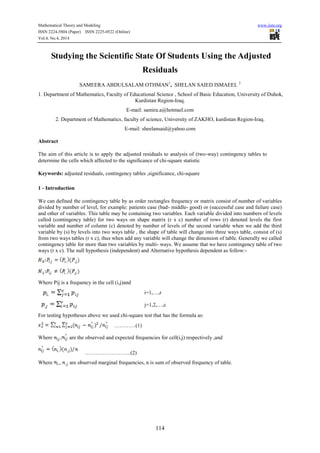
  • 1. Mathematical Theory and Modeling www.iiste.org ISSN 2224-5804 (Paper) ISSN 2225-0522 (Online) Vol.4, No.4, 2014 114 Studying the Scientific State Of Students Using the Adjusted Residuals SAMEERA ABDULSALAM OTHMAN1 , SHELAN SAIED ISMAEEL 2 1. Department of Mathematics, Faculty of Educational Science , School of Basic Education, University of Duhok, Kurdistan Region-Iraq. E-mail: samira.a@hotmail.com 2. Department of Mathematics, faculty of science, University of ZAKHO, kurdistan Region-Iraq. E-mail: sheelansaid@yahoo.com Abstract The aim of this article is to apply the adjusted residuals to analysis of (two-way) contingency tables to determine the cells which affected to the significance of chi-square statistic Keywords: adjusted residuals, contingency tables ,significance, chi-square 1 - Introduction We can defined the contingency table by as order rectangles frequency or matrix consist of number of variables divided by number of level, for example: patients case (bad- middle- good) or (successful case and failure case) and other of variables. This table may be containing two variables. Each variable divided into numbers of levels called (contingency table) for two ways on shape matrix (r x c) number of rows (r) denoted levels the first variable and number of column (c) denoted by number of levels of the second variable when we add the third variable by (s) by levels into two ways table , the shape of table will change into three ways table, consist of (s) from two ways tables (r x c), thus when add any variable will change the dimension of table. Generally we called contingency table for more than two variables by multi- ways. We assume that we have contingency table of two ways (r x c). The null hypothesis (independent) and Alternative hypothesis dependent as follow:- Where Pij is a frequency in the cell (i,j)and i=1,…,r j=1,2,…,c For testing hypotheses above we used chi-square test that has the formula as: …………(1) Where , are the observed and expected frequencies for cell(i,j) respectively ,and ……………………..(2) Where , are observed marginal frequencies, n is sum of observed frequency of table.
  • 2. Mathematical Theory and Modeling www.iiste.org ISSN 2224-5804 (Paper) ISSN 2225-0522 (Online) Vol.4, No.4, 2014 115 After calculate the value of ( ) from the formula (1) above we compare it with the tabulated value under significant level α and degrees of freedom (r-1)(c-1) 2- Definitions:- Contingency table: data arranged in table form for the chi-square independence test, with r rows and c columns. Observed frequency : the actual frequency value obtained from a sample and used in the chi-square test. Null hypothesis: a statistical hypothesis that states that there is no difference between a parameter and a specific value or that there is no difference between two parameters. Alternative hypothesis: a statistical hypothesis that states a difference between a parameter and a specific value or states that there is a difference between two parameters. Degrees of freedom: the number of value that is free to vary after a sample statistic has been computed; used when a distribution (such as the t distribution) consists of a family of curves. Level of significance: the maximum probability of committing a type I error in hypothesis testing Independence test: a chi-square test used to test the independence of two variables when data are tabulated in table form in terms of frequencies. 3-Adjust residuals method: During the 1978, Haberman suggested method of test after the significant ( ) in contingency table. We can summarize by the following steps: -Compute the value of standard error cell (i,j) by following formula: ……………………..(3) -Compute the value of asymptotic variance as: ……………………………..(4) -Compute the value of adjusted residual as: N(0,1)………………………..(5) We compare the absolute value ( ) with tabulated value for standard normal distribution by level of significant (0.05) i.e., (1.96), if the value of ( ) is greater than (1.96) it is mean that significant, which means that the relation between level(i)from first variable and (j) level from second variable is significant, and value ( ) is less than (1.96) reference to the relation between level of (i) and (j) are insignificant. We can determine the responsible for the relation between variables are significant. 5-Collection of data We take the data during the (questionnaire) which is mentioned in the appendix (A) which is distributed the two college (Basic Education in Duhok and Education in Zakho city), we got (101) form (63 ) females and ( 38 ) males. We grouped the data on the two ways table by using icon (table) in the software of Minitab (13.2) as show that in the tables below:
  • 3. Mathematical Theory and Modeling www.iiste.org ISSN 2224-5804 (Paper) ISSN 2225-0522 (Online) Vol.4, No.4, 2014 116 Table(1) : relation between level study and sex of each student. Level of student Sex Weak Pass Middle Good Very good total Male 12 21 21 21 5 63 Female 9 3 5 9 21 38 Total 30 15 22 19 15 101 Table(2) : relation between level study for student and Father’s level education student. Table(3) : relation between level study for student and Mother’s level education student. Level of student Father’s level education student Weak Pass Middle Good Very good total Ignorance 5 9 5 5 5 29 Primary 3 3 8 6 3 23 Middle 6 1 1 3 1 20 High school 6 1 2 1 1 11 University 21 2 2 3 3 18 Total 30 15 22 19 15 101 Level of student Mother’s level education student weak Pass Middle Good Very good total Ignorant 3 21 21 22 1 36 Primary 8 3 8 6 3 28 middle 4 2 1 1 4 11 High school 8 2 2 2 3 14 University 1 2 2 2 2 12 Total 30 17 22 19 13 101
  • 4. Mathematical Theory and Modeling www.iiste.org ISSN 2224-5804 (Paper) ISSN 2225-0522 (Online) Vol.4, No.4, 2014 117 Table(4) : relation between level study for student and economic case for the family. Level of student economic for the family. weak Pass Middle Good Very good total Weak 6 2 1 5 6 20 Middle 1 9 24 6 4 40 Good 8 1 3 5 3 21 Very good 9 3 3 3 1 20 Total 30 15 22 19 15 101 Table (5): relation between levels studies for student and for student and is mother still life. Level of student Mother still life weak Pass Middle Good Very good total Yes 11 9 28 25 6 70 No 8 6 4 4 9 31 Total 30 15 22 19 15 101 Table (6): relation between levels studies for student and is father still life. Level of student father still life weak Pass Middle Good Very good total Yes 14 21 23 24 8 69 No 6 5 9 5 1 32 Total 30 15 22 19 15 101 Table (7) : relation between level study for student and members of the family which student contain. Level of student members of the family weak Pass Middle Good Very good total 1-5 21 3 5 1 4 24 6-10 21 11 7 11 6 56 11 more 21 1 10 5 5 31 Total 30 15 22 19 15 101
  • 5. Mathematical Theory and Modeling www.iiste.org ISSN 2224-5804 (Paper) ISSN 2225-0522 (Online) Vol.4, No.4, 2014 118 Table (8): relation between level study for student and is the student work or not. Level of student the student work weak Pass Middle Good Very good total Work 21 4 9 6 8 39 not work 21 22 23 14 1 62 Total 29 15 22 20 15 101 6-Analysis of data: We calculate the ( )values for the tables above to know if there are significant relationships between levels two variables that have been studied or not, by formula (1) by using (chis) in the software Minitab and that have been sum marriages in the table (9) below. Table (9): the chi-square values for the table (1-8) Tables 1 2 3 4 5 6 7 8 11.049* 26.304* 34.383* 18.006 9.345 4.585 13.145 3.043 9.49 26.296 26.296 21.026 9.49 9.49 15.507 9.49 We note from the above table that the relation between the levels of variables in tables (1), (2), (3) significant. But the other tables are not significant. Therefore the method is explained in the formulas from (3) to (5) will apply on these three tables (1-3) only, because we have not special icon to calculate (dij) contain software program in statistic, we write the program ( 1 ) in appendix (B) by using commands of software Minitab, to compute it . When we applied in these three tables above we obtained these tables. Table (10) : the values of Adjust residuals for the table (1). Level of student Males Female ei. e.j di. dj. weak 12 9 31 2903169 2106932 1038531 1034511- 10151564 10451411 1016911 3048145-* pass 21 3 25 906535 503465 1015514 1024244- 10313511 10541985 2031191 1089181*- middle 21 5 11 2402584 108426 1015528 1043396- 10118196 10513381 2043114 3043155*- good 21 9 29 2101111 601113 1063111- 1091315- 10189383 10511498 2028411- 2011691- Very good 5 21 25 906535 503465 2049113- 1022253 10313511 10541985 1012861*- 1025161
  • 6. Mathematical Theory and Modeling www.iiste.org ISSN 2224-5804 (Paper) ISSN 2225-0522 (Online) Vol.4, No.4, 2014 119 Table (11) : the values of adjust residuals for the table (2). Level of student level of father Weak d1. Pass d2. Middle d3. Good d4. Very good d5. Ignorant 10512211 10616999 10551591 10518161 10616999 2013941- 1091154* 1011265- 1015632- 10418646 Primary 10541888 10651583 10614158 10616991 10651583 2098961- * 1011146- 2012881 2012591 10111461- Middle 10563168 10681814 10611192 10652223 10681814 1013146 1068219- 2059925 1048119- 10682194- High school 10616419 10158149 10696991 10113458 10158149 2092123 2046134- 2018118- 1015664- 10319142 University 10511688 10699135 10641181 10661289 10699135 1064185* 2011341- 2083985- 1015691- 10138894 Table (12) : the value of adjust residuals for the table (3). Level of student level of mother Weak d1. Pass d2. Middle d3. Good d4. Very good d5. Ignorant 1045141 1 105351 41 1051338 1 1051149 8 1056111 9 3049112 *- 102882 1* 201863 9 1014149 * 2063388 - Primary 1051818 1 106122 28 1056533 1 1058681 5 1061914 1 1025423 - 201216 6- 201131 6 1042614 1041191 - Middle 1061641 9 101422 14 1069699 1 1011345 8 1011639 4 1052124 101169 1- 103164 6- 2069214 - 1046414 * High school 1061551 9 101264 11 1061315 1 1069934 3 1015152 5 1041192 * 201439 8- 204198 1- 2011315 - 2013121 University 1062944 9 101318 69 1068914 6 1012541 1 1016116 8 1032124 * 101261 8- 201113 1- 1098945 - 1051116 - Discussion and analysis the results: 1- Although the value significant between the scientific level of the student and his sex, there are four cells from total ( 10 ) cause cells for significant, all of them from negative direction as the table (10). 2- From the studding special table by relation between levels scientific for student and father education levels, we noticed there are three of cells responsible for the significant relation between the two variables, we see for example the father’s education (primary down) there is(1) from cell responsible for significant. There is one cell their effected to minuses direct there are reaction this level from father’s education with the level (pass) from student scientific level. This is also agree with scientific logical (notice table 11). 3- We notice through the table (12) the cells (or the reaction between the levels of student scientific level and the mother’s scientific levels) that responsible for the relation significant between these two variables is more compare with the number of significant reaction between the levels student scientific level, and father’s education levels and this mean the student scientific level the effective is more by mother’s education level from father’s education level. Through the results from these searches from scientific application results to use straighten reminder method in table analysis. The researcher that is very important make this test and don’t desisting from significant ). References Agresti, A, Lipstiz and LANG, J.B. (1992), Comparing marginal distributions Large, sparse tables, Computational Statistics and Data Analysis, 14, 55, 73. Agresti, A, Liu, I. (1999), Modeling a categorical variable allowing arbitrarily Category choices Submitted to Biometrics. Bishop, Y.M.M, Fienberg, S.Y. and Holland, P.W. (1975), Discrete
  • 7. Mathematical Theory and Modeling www.iiste.org ISSN 2224-5804 (Paper) ISSN 2225-0522 (Online) Vol.4, No.4, 2014 120 Multivariate Analysis: Theory and Practice', the MIT Press Cambridge Massachusetts and London. Everitt, B.S. (1977), The Analysis of Contingency Tables, Chapin and Hall Ltd., London. Haberman,S.J. (1978), Analysis of qualitative data vol. 1, Academic Press INC, London. Appendix(A): The (questionnaire) which affected the level study of student: 1. sex of student: Male female 2. Father’s level education student : ignorance Primary Middle High school University 3. Mother’s level education student : ignorance Primary Middle High school University 4. economic case: Weak Middle Good very good 5. is father still life: yes no 6. is mother still life: yes no 7. number individual family: 8. is student have the work : yes no 9. level of the student: Weak pass Middle Good very good Appendix (B) The software Minitab(13.2) is used in the following macro programs. Program(1): gmacro aa.macro let k1=101 let k3= sum( c1)
  • 8. Mathematical Theory and Modeling www.iiste.org ISSN 2224-5804 (Paper) ISSN 2225-0522 (Online) Vol.4, No.4, 2014 121 let k4= sum( c2) print k3,k4 do k2=1:5 let c3(k2)=c1(k2)+c2(k2) let c4(k2)= k3*c3(k2)/k1 let c5(k2)= k4*c3(k2)/k1 let c6(k2)= (c1(k2) -c4(k2))/(c4(k2)**0.5) let c7(k2)=(c2(k2)-c4(k2))/(c4(k2)**0.5) let c8(k2)= (1-k3/k1)*(1-c3(k2)/k1) let c9(k2)=(1-k4/k1)*(1-c3(k2)/k1) let c10(k2)= c6(k2)/c8(k2)**0.5 let c11(k2)=c7(k2)/c9(k2)**0.5 enddo endmacro program(2): gmacro aa.macro let k1=101 let k3= sum( c1) let k4= sum( c2) let k5=sum(c3) let k6=sum(c4) let k7=sum(c5) print k3,k4,k5,k6,k7 do k2=1:5 let c6(k2)=c1(k2)+c2(k2)+c3(k2)+c4(k2)+c5(k2) let c7(k2)= k3*c6(k2)/k1 let c8(k2)= k4*c6(k2)/k1 let c9(k2)= k5*c6(k2)/k1 let c10(k2)=k6*c6(k2)/k1 let c11(k2)=k7*c6(k2)/k1 let c12(k2)= (c1(k2) -c7(k2))/(c7(k2)**0.5) let c13(k2)=(c2(k2)-c8(k2))/(c8(k2)**0.5) let c14(k2)=(c3(k2)-c9(k2))/(c9(k2)**0.5)
  • 9. Mathematical Theory and Modeling www.iiste.org ISSN 2224-5804 (Paper) ISSN 2225-0522 (Online) Vol.4, No.4, 2014 122 let c15(k2)=(c4(k2)-c10(k2))/(c10(k2)**0.5) let c16(k2)=(c5(k2)-c11(k2))/(c11(k2)**0.5) let c17(k2)= (1-k3/k1)*(1-c6(k2)/k1) let c18(k2)=(1-k4/k1)*(1-c6(k2)/k1) let c19(k2)=(1-k5/k1)*(1-c6(k2)/k1) let c20(k2)=(1-k6/k1)*(1-c6(k2)/k1) let c21(k2)=(1-k7/k1)*(1-c6(k2)/k1) let c22(k2)=c12(k2)/c17(k2)**0.5 let c23(k2)=c13(k2)/c18(k2)**0.5 let c24(k2)=c14(k2)/c19(k2)**0.5 let c25(k2)=c15(k2)/c20(k2)**0.5 let c26(k2)=c16(k2)/c21(k2)**0.5 enddo endmacro