SlideShare uma empresa Scribd logo
1 de 10
Baixar para ler offline
Research on Humanities and Social Sciences www.iiste.org
ISSN 2222-1719 (Paper) ISSN 2222-2863 (Online)
Vol.3, No.10, 2013
96
Residential Differentials in Incidence and Fear of Crime
Perception in Ibadan
Adigun, Folasade Oyenike
Department of Urban and Regional Planning, Ladoke Akintola University of Technology, Ogbomoso
foadigun@lautech.edu.ng
Abstract
The paper examines crime experienced by residents and the fear of crime events in residential areas of Ibadan. It
was observed that households of the high and medium densities have higher average residential crime experience
(ARCE) than average crime experienced by any household in Ibadan while households in the low density
residential area have a lower ARCE. Findings on fear of crime indicate that the low density residential area has
the highest mean FCEI value (1.1) followed by the medium (0.8) then the high density (0.5). The pattern of fear
of crime events (FCEI) observed in Ibadan is a reverse of the pattern of residential crime magnitude (RCM) and
average crime experienced (ARCE) among the three residential areas. The study suggests that strategies of
dealing with crime and its fear should be done in collaboration with local communities so as to reflect the
experiences and concerns of residents.
Keywords: crime, events, fear, residential area
1. Introduction
The problem of skyrocketing, daunting and seemingly untameable urban crime has become a nerve-racking
phenomenon to all and sundry. The consequences of crime are evident on the residents, quality of life and the
liveability of cities. This manifests in the loss of investment, lives and properties. Coupled with these is the
resulting conducive terrain for strengthening of deeply rooted crime cultures and other socio- economic
implications on the residents and image of cities. Besides, there are countless emotional consequences of crime
on human beings; chief among which is fear and insecurity. Fear has been regarded as the immediate ‘within’ (or
internal) response that poses threat to human safety (Afon 2001).
Fear of crime is conceived to arise from concern about crime, the consequences of victimization, the probability
of being victimized, feelings of vulnerability and wider social and situational influences (Department of Justice,
Equality and Law Reform 2009). Several factors influence fear of crime. These are: gender, age, nationality,
marital status, education level, locality, official crime rate, perception of crime in local area, prior experience of
victimization among others (Department of Justice, Equality and Law Reform 2009). Repeatedly in the literature,
studies of fear of crime point to a paradox that those groups that expressed the highest level of fear of crime
typically have the lowest victimization rates (Stafford & Galle 1984). Women and the elderly are more fearful of
crime while better educated and prosperous people are less fearful of crime (Melbourne Institute of Applied
Economic and Social Research). While fear of crime can be differentiated into public feelings, thoughts and
behaviours about the personal risk of criminal victimization, distinctions can also be made between the tendency
to see situations as fearful, the actual experience while in those situations, and broader expressions about the
cultural and social significance of crime and symbols of crime in people's neighbourhoods and in their daily
symbolic lives (Encyclopaedia).
Crimes and its consequences occur not only within, but are also influenced and may indeed be compounded by a
wide range socio-economic and environmental context, summarized in urban residential patterns (Faris &
Dunham 1939; Shaw & McKay 1942; Bagley et al 1976; Aguda 1994; Agbola 1997; Afon 2001; Phillip 2008,
Adigun 2012). For instance in the study carried out by Shaw & McKay (1942) in the city of Chicago, it was
documented that juvenile delinquency conforms to a regular spatial pattern in Chicago; with the highest rates at
the inner-city zones (i.e. around the central business district) and a declining rate with increasing distance from
the centre. Thus the areas with low delinquency are located mostly near the city’s periphery.
Afon (2001) in his analyses of occurrence of criminal activities in Ilorin found that all categories of crime
investigated occurred in the high density area. Nonetheless, some criminal activities are peculiar to certain
densities with different degrees of incidence. This is attributed to varying social and economic attributes of
the residents as well as the environmental characteristics of the residential areas in Ilorin. 'House breaking'
was observed to be more in the low density area than in the remaining two densities. This supports earlier
findings of Aguda (1994).
Using residential densities as basis for data collection, Agbola (1997) explored the impact of the increasing
urban violence in Nigerian cities on physical planning, urban design and building construction practices. Among
cases reviewed, the incidence of burglary and other crimes such as armed robbery, loitering, street fighting,
hooliganism, prostitution, drug dealing and gambling are found to be more in the high density (22.11percent) and
Research on Humanities and Social Sciences www.iiste.org
ISSN 2222-1719 (Paper) ISSN 2222-2863 (Online)
Vol.3, No.10, 2013
97
decreases through the medium (19.49 percent) to the low (16.99 percent) density residential areas. The highest
incidence of urban violence is robbery with 47.37 percent followed by burglary with 32.02 percent. The number
of victims of urban violence is more in the high density residential. The highest proportion of lives lost to urban
violence is recorded at the low density residential areas. Abodunrin (2004) reported a similar pattern of crime
distribution in Ogbomoso. The high density residential areas had the highest crime incidence (47.2 percent)
within the period studied while 34.7 percent and 18.1 percent crime cases were recorded in the medium and low
density residential areas. In the same vein, it was observed that youth crime has spatial implication in Toronto
(Charron 2012). Most of Toronto’s police-reported incidents of youth crime took place in an outdoor public
space (33%) or commercial establishment (32%). The study identified more youth crimes in places that are more
easily accessible to them and where there is less social control. These studies conclusively demonstrate that first,
there are notable geographical variations in the patterning of crime locations and secondly, these variations differ
in regards to type of crime. The current study does not only investigate the occurrence of crime in each
residential density using residents' declaration of crime incidence but also the fear of events associated with
criminal incidences.
Consequent upon the established relationship between crime and residential area the data for this study was
collected based on residential zones. According to Afon (2005) the use of urban residential zones has been
considered a reliable basis for the collection of primary data for the subsequent reasons (Hebert & Johnston 1978;
Gana 1996). First, residential zones in urban centres tend to show more permanent geographical attributes in
terms of locations, structures, housing types, commercial activities etc. Secondly, these permanent geographical
attributes objectively represent the social, economic and cultural attributes of the residents (Herbert & Johnson,
1978). Thirdly each residential zone is likely to internally contain residents’ that have homogeneous social and
economic characteristics (Gana 1996). Fourthly, by grouping urban centre into residential zones the analysis of
who live in each, the crime experienced and fear of same in each group is relatively simplified.
The study therefore examines the incidence of crime and residents’ level of fear of associated events within the
context of residential neighbourhoods in Ibadan with a view to establishing a link between incidence and fear of
crime.
2. Study Area
Ibadan is located approximately on longitude 30
51
East of the Greenwich meridian and latitude 70
231
North of
the equator at a distance of 145 kilometers north east of Lagos. Ibadan region is described as an area extending
for about 55km from Asejire in the East to Agemo in the West and for about 700km from Iroko in the north to
Mamu in the South (Akinola 1963 cited by Akintola (1994). The city was founded in the 1820s (Mabogunje
1968). Ibadan city is one of the Yoruba traditional urban centres whose urbanization predates colonialism. The
city grew from a population size of 200,000 souls in 1890 to 175,000 in 1911, 238,075 in 1921, 459,196 in 1952,
and 1,783,962 in 1981 (Mabogunje 1968 and Ayeni 1994) to 1,338,659 in 2006 (NPC, 2006). Ibadan is made
up of eleven local government areas, out of which five are found in the inner city surrounded by the remaining
six local government areas. This comprises of Ibadan North, Ibadan North east Ibadan, Ibadan North west,
Ibadan South east, Ibadan South west, Akinyele, Lagelu, Egbeda, Ona-Ara, Oluyole and Ido. Ibadan is directly
connected to many urban centres and their rural hinterland by system of roads, railways and air routes.
3. Research Methodology
The study utilized primary data obtained through questionnaire administered to residents. Information obtained
includes residents’ socioeconomic characteristics, household crime experienced within six months and level of
fear of crime. Five local government areas of Ibadan formed the sampling frame. These include Ibadan north,
Ibadan north east, Ibadan northwest, Ibadan south east and Ibadan south west. These are referred to as the inner
LGAs of Ibadan. Localities within the three distinct residential areas were identified. Previous research efforts
identified three major categories of residential areas which are distinct in social as well as physical attributes
(Onokerhoraye & Omuta, 1986; Afon 2004). These are: low quality residential area usually (high density
residential zone); medium quality residential area (medium density residential zone) and high quality residential
area (low density residential zone). In modern urban centres residential density is described in terms of floor area
ratio and population. In traditional urban centre traditional/core, transitional and suburban residential areas
represent the three residential areas highlighted above (Onibokun 1972). According to Okewole (1977)
historically, the traditional core area is a pre-colonial development occupied by indigenous population and or the
early settlers. This area is often found in the heart of the city (Onerkerhoraye & Omuta, 1985). The transitional
residential area developed during the colonial era forms the next layer of development. The sub- urban/low
density residential area could be pre and post independence developments. In cities of this nature socio-
economic characteristics (such as level of education, occupation and income) and environmental quality are
considered to vary inversely with density. These features were used in identifying the three residential areas.
Research on Humanities and Social Sciences www.iiste.org
ISSN 2222-1719 (Paper) ISSN 2222-2863 (Online)
Vol.3, No.10, 2013
98
The study employed a multi stage sampling technique. The random and systematic sampling techniques were
used within the context of already stratified local government areas and the three residential zones. The first
level of stratification was done on the basis of the delineated local government areas. The second level of
stratification was based on identified residential areas. Localities with the features of the three residential areas
were identified in each local government area and purposively selected for the study. The first building in each
randomly selected street was chosen at the discretion of the researcher. Subsequent selection was done at an
interval of ten buildings. To cater for residents in landlocked portions of the core area where buildings are not
accessible by roads, buildings were selected at uniform interval of every five building off the roads. The target
population are the residents. A household was selected from each chosen building from where a resident not less
than 18 years either male or female was sampled. The selected residents were investigated using a structured
questionnaire. A total of 654 copies of the questionnaire out of the 671 distributed were considered useful for the
analysis. This represent 97.47 percent recovery rate.
Data analysis was mainly descriptive. Three indices were developed in this study. These are ‘Residential Crime
Magnitude’ (RCM), ‘Average Residential Crime Magnitude’ (ARCE) and ‘Fear of Crime Events Index’ (FCEI).
The first is the aggregate of crime experienced by households while the second is the average of this aggregate.
ARCE was calculated as the mean of RCM. This was done for each residential area and the whole city. The
mathematical expression is as follows:
ARCE = RCM/N (1)
Where :ARCE = Average residential crime magnitude
RCM = Residential Crime Magnitude
N = Number of respondent
The third index measures residents’ level of fear of events associated with crime incidence. Variables indicating
FCEI were measured in ranking scale of Likert as “very high” (5), “high”(4), “moderate (3)”, “low”(2) and “very
low”(1). The FCEI was obtained by dividing the summation of weighted value (SWV) by the total number of
responses. The SWV of each variable is the addition of the product of the proportion of responses to it and the
weighted value attached to each rating. This is done for each residential area. The mathematically expression is
as follows:
FCEI = SWV/Ni (2)
SWV = NiVi (3)
Where: FCEI = ‘Fear of Crime Events Index’
SWV = Summation of weight value
Ni = Number of Respondents rating variable i; and
Vi = weight assigned to variable i
4. Results and Discussion
4.1 Crime Incidence in Residential Neighbourhoods
The data obtained on crime experienced by residents were summarised into ten categories. This categorization
was done based on lessons from previous studies (Tanumo 1991; Sullivian 1996; Omisakin 1998; and
Abodunrin 2004) coupled with the intuition of the researcher. Crime types were categorized into ten broad
groups (see table 2).
4.2 Intra Urban Variation in Crime Experienced by Households
There is significant variation in the value of RCM recorded in the three residential zones (X2 = 1279.04; df =2,
table value = 5.991, at 0.05 level of significance). This implies that there is intra-city variation in total number of
crime experienced by households in the residential areas. In other words residents of the three residential areas
experienced crime differently. The RCM of each residential area was taken as a proportion of the city total and
comparison is made among the three residential areas. It was observed that the low density of Ibadan has the
least proportion of RCM (13.2%) compared to medium and high densities with 35.5% and 51.3% respectively.
Summarily crime experienced by households decreased in magnitude from the high to the medium then the low
density residential areas.
This finding is not different from what scholars have recorded in previous studies. For instance Agbola (1997)
and Afon (2001) observed the most significant level of crime incidence in the high density area of Lagos and
Ilorin respectively. Sampsom et al (2002) also stated that disadvantaged neighbourhoods are more criminogenic.
This study however argues that the general conception that crime figure is more in the high density residential
areas should not be taken religiously without relating it to the population size more so that higher population size
in high density residential areas (Adeboyejo & Onyeororu 2003) could account for higher magnitude of crime.
This kind of analysis will provide an opportunity to establish the average crime experienced by households in the
area.
Research on Humanities and Social Sciences www.iiste.org
ISSN 2222-1719 (Paper) ISSN 2222-2863 (Online)
Vol.3, No.10, 2013
99
4.3 Average Residential Crime Experienced by Households (ARCE)
The incidence of crime was taken as a quotient of sample size in each residential area and city. The high density
of Ibadan has the highest ARCE of 9.4 followed by the medium and low densities with 9.2 and 6.9 respectively.
This implies that average of nine crime incidences are experienced by a single household in the high density
residential areas within six months. This may sounds so high but it should be noted that a household has one or
more individuals which in many cases are more than six persons in the high density residential areas. The
ARCEs obtained for the medium and low density areas can also be interpreted in the same way.
The intra-city difference is further illustrated by comparing the residential area ARCE with the city ARCE. It
was observed that the high and medium densities of Ibadan have respectively an ARCE value of 0.5 and 0.3
above the city ARCE. Simply put the residents of these areas have higher crime experience than average crime
experienced by any household in Ibadan. The low density has -2 below the city ARCE (see table 3). Households
in this residential area have a reverse of the experience of the first category. In other words they have a lower
crime experience than an average household in the city. Conclusively the residential areas with ARCE figure
higher than the city average could be considered more prone to crime than others. This indicates that the high
and medium density residential areas are more prone to crime than the low density areas. This pattern conforms
to the observations in the literature (Agbola 1997 and Afon 2001; Sampsom et al 2002; Abodunrin 2004). When
these crime totals are disaggregated into their respective categories an informative scenario evolved and is
documented in the next section.
4.4 Spatial Variation in the Categories of Crime Experienced by Households
There is significant intra-city variation in the magnitude of crime categories in the study area (F ratio = 5.606, P
value = 0.001, at 0.05 level of significance). This implies that the incidence of different crime category
significantly varies from one another among the three residential areas in the study area. The pattern of incidence
is similar for certain crime categories such as crime of acquisition, crime against morality and custom, public
disorderliness and white collar crime (see table 4). The incidence of these crime categories decreases from the
high density to the medium then the low density residential areas. On the other hand crime of stealth/pretence
and assaults records highest incidence in the medium density followed by the low then high densities.
Within each residential density crime categories however displayed varying patterns. In the high density
residential area, the next category after crime of acquisition (57.7%) is crime of public disorderliness (24.1%),
white collar crime (10.8%) then assaults (2.5%) and crime against morality and custom (1.6%). White collar
crime (11.2%) comes second after crime of acquisition (66.9%) in the medium density leaving stealth/pretence
(5.4%) and assaults (4.8%) in the third and fourth position. In descending order of incidence crime categories
forms this pattern in the low density area: acquisition (44.5%), white collar crime (12.5%), crime of public
disorderliness (10.7%), assaults (10.0%) and stealth/pretence (8.3%). The least occurring category is crime
against public law and order in the low density residential area but unnatural crime in the medium and high
densities.
4.5 Fear of Crime Events in Ibadan
The mean FCEI value for the three residential areas is 0.8 (see table 5). The mostly dreaded crime events are
‘shock/psychological imbalance’ and ‘properties carted away’ with 1.1 each; ‘self torture/beaten’ (1.0); ‘killing
of household member’ and loss of one’s life each with 0.9. These events have positive deviation about the city
FCEI. On the other hand, events with negative deviation about the city FCEI include self raped (0.7); kidnapping
(0.6); vandalization of vehicle (0.5). Other events in this category are burning of house/properties and burning of
vehicle each with 0.4. These events could be regarded as less fearful events of crime in the city of Ibadan.
Respondents dread these events but not as the ones in the first category. Residents had the same level of fear for
some events as the average level of fear of crime events in the city. These are ‘female household member raped’;
female household member tortured/beaten, infection with HIV/AIDS/other STD and destruction of window/door
locks and or burglar proof each with 0.8.
Included in table 5 is the mean FCEI value for each residential area. The low density has the highest mean value
(1.1) followed by the medium (0.8) then the high density (0.5). Within the low density, events of crime that
residents feared above the average level of fear for all crime events in this area are ‘shock/psychological
imbalance’ and ‘‘properties carted away’’ with 1.81 each; money stolen (1.6); ‘killing of household member’
(1.4); loss of one’s life and self tortured/beaten each with 1.3 and female household member raped (1.2). Events
that residents fear less include infection with HIV/AIDS/other STD (1.0); self raped and destruction of
window/door locks/burglar proof with 0.9 each; kidnapping (0.8) and vandalization of vehicle (0.7). Others are
burning of houses/properties and burning of vehicles each with 0.5. The most dreaded events are
‘shock/psychological imbalance’ and ‘‘properties carted away’’ while the least are burning of houses/properties
and burning of vehicles. Destruction of properties is of less concern to the rich, some could even use properties
as ransom for their lives. But issues that border on their lives and health seems paramount to them presuming
that criminals are oftentimes interested in carting away valuables except hired or sponsored killers. Though this
Research on Humanities and Social Sciences www.iiste.org
ISSN 2222-1719 (Paper) ISSN 2222-2863 (Online)
Vol.3, No.10, 2013
100
area had the lowest residential crime magnitude and average crime experienced yet the level of fear of crime
events is high. This suggests that there are other factors which influence level of fear of crime events.
Information on crime incidences, agitation as well as expectations of eventualities of crime may contribute to
this.
In the medium density crime events that residents feared above the average level of fear of crime events include
self tortured or beaten (1.1); loss of one’s life; ‘killing of household member’; female household member
tortured/beaten; ‘‘properties carted away’’ and ‘shock/psychological imbalance’, money stolen each with FCEI
value of 0.9. On the other hand residents fear some events below the average level of fear of crime events in the
area. These include self raped; kidnapping and money stolen with 0.7 each; vandalization of vehicle (0.6);
burning of houses/properties and burning of vehicles with 0.5 each. Female household member raped and
infection with HIV/AIDS/other STD had the same FCEI value (0.8) with city and medium density FCEI value.
The most and least feared of all crime events understudied is self tortured or beaten and, burning of
houses/properties and burning of vehicles respectively.
Residents of the high density have high fear for some crime events than average fear of crime events in their area.
These include destruction of window/door locks/burglar proof (0.9); ‘shock/psychological imbalance’ (0.7); loss
of one’s life; ‘killing of household member’; self tortured/ beaten with 0.6 each. Female household member
raped; self raped; female household member tortured/beaten; infection with HIV/AIDS/other STD; property
carted away and money stolen have the same FCEI value equivalent of the mean FCEI for this density. Residents
have less dread of some crime events than average fear of crime events in the area. These include kidnapping
(0.4); vandalization of vehicle; burning of houses/properties and burning of vehicles with 0.3 each. The high
density dwellers have high fear of destruction of window/door locks/burglar proof while the least feared is
burning of vehicles. Residents may fear the crime events that give way to other crime events or that rendered
them more vulnerable to attack. Window/door locks/burglar proof is one of households’ safety measures of
common place in our society. The poor has a fear of criminals destroying this security barrier and breaking in,
much more that there are less valuables to offer.
It was observed that some crime events within the residential areas have FCEI either above or below the mean
FCEI of Ibadan. On a general note all the identified crime events in the high density have lower FCEI than
Ibadan’s FCEI of 0.8 except destruction of window/door locks and or burglar proof. This implies that residents
of the high density of Ibadan had low level of fear for crime events. This is probably due to the nature of the
selected localities which are core areas with considerable traditional Yoruba virtues of cohesion, communalism
and good neighbourliness all of which discourages anonymity: an enhancing factor for criminality. The medium
density has the same FCEI value as the city mean FCEI. Eleven events in the low density have FCEI value above
the city FCEI value while three events have FCEI value below it. This is indicative of high level of fear of crime
events in the area.
The pattern of fear of crime events observed in Ibadan is a reverse of the pattern of residential crime magnitude
and average crime experienced among the three residential areas. Fear of crime events is at the lowest ebb in the
high density where the highest ARCE was recorded while the low density had a greater level of fear of events
associated with crime even though the lowest ARCE was observed. This indicates that there are other factors
dictating fear of crime apart from crime experienced though these are not covered by this study.
5.0 Conclusion
Residents of the three residential areas of Ibadan experienced crime differently. The high density of Ibadan has
the highest average residential crime experienced (ARCE) of 9.4 followed by the medium and low densities with
9.2 and 6.9 respectively. Not only this the incidence of different crime category significantly varies from one
another among the three residential areas The pattern of incidence is similar for certain crime categories such as
crime of acquisition, crime against morality and custom, public disorderliness and white collar crime. The
incidence of these crime categories decreases from the high density to the medium then the low density
residential areas.
The most dreaded crime events in the study area are ‘shock/psychological imbalance’ and ‘properties carted
away’ with 1.1 each; ‘self torture/beaten’ (1.0); ‘killing of household member’ and loss of one’s life each with
0.9. These events have positive deviation about the city FCEI. It was observed that some crime events within the
residential areas have FCEI either above or below the mean FCEI of Ibadan. All the identified crime events in
the high density have lower FCEI than Ibadan’s FCEI of 0.8 except destruction of window/door locks and or
burglar proof. This implies that residents of the high density residential areas of Ibadan had low fear of crime
events. The pattern of fear of crime events observed in Ibadan is a reverse of the pattern of residential crime
magnitude and average crime experienced among the three residential areas. Fear of crime events is at the lowest
ebb in the high density where the highest ARCE was recorded while the low density had a greater level of fear of
events associated with crime even though the lowest ARCE was observed. This indicates that there are other
Research on Humanities and Social Sciences www.iiste.org
ISSN 2222-1719 (Paper) ISSN 2222-2863 (Online)
Vol.3, No.10, 2013
101
factors dictating fear of crime apart from crime experienced. Examination of these factors could be a basis for
further research work in the study area. In order to further the understanding of the spatial distribution of the
subject of discourse, the dichotomy could also be investigated among cities of different sizes as well as between
urban and rural areas.
The study by examination of the level of fear associated with different crime events has provided an insight into
what should be addressed provided or improved in order to enhance liveability in the cities. The results of this
research show that incidence and fear of crime has spatial variation, indicating that strategies of dealing with
crime and its fear should reflect these differences. Thus, areas with high crime incidence and fear should receive
more attention. In addition, intervention in residential areas should be done in collaboration with local
communities so as to reflect the experiences and concern of residents.
References
Abodunrin, F.O. (2004). Spatio-Temporal Variation and Residents Response to Crime in Ogbomoso. M.Tech,
Dissertation Department of Urban and Regional Planning, Ladoke Akintola University of Technology.
Adigun, F. O. (2012). Spatio-temporal Analysis of Urban Crime in Selected Nigerian Cities.
Ph. D dissertation, Department of Urban and Regional Planning, Ladoke Akintola University of Technology,
Ogbomoso.
Afon, A.O (2001). "Resident Diversity Factor in the Perception of and Response to Fear of Crime in Nigeria".
Paper presented at the International Conference on Security, Segregation and Social Networks in West Africa
Cities 19'th
– 20th
centuries, held at the International Centre for African Studies (IFRA) University of Ibadan.
Afon, A.O (2005). “Solid Waste Management in Selected Cities of Oyo State, Nigeria. Ph.D submitted to the
Department of Urban and Regional Planning, Obafemi Awolowo University.
Agbola, Tunde (1997). Architecture of Fear, Urban Design and Construction Response to Urban Violence
in Lagos, Nigeria. Ibadan. IFRA.
Aguda, A.S. (1994). Area Ecological Analysis of Crime. A Case Study of a Nigerian City. In Albert, I.O, Adisa,
J Agbola T. and Herault, G. (eds) Urban Management and Urban Violence in Africa. Vol. 1 pp l-8. Ibadan.
IFRA
Akinola R.A (1963). “The Ibadan Region.” Nigerian Geographical Journal Vol. 6 pp. 102-15 cited by Akintola,
F.O. (1994). Geology and Hydro Geology Filani, M. O., Akintola, F.O. and Ikporukpo, G. O. (eds) Ibadan
Region , Department of Geography, University of Ibadan. pp72-84
Bagely, C., Jacobson, S. and Rehin, A. (1976). 'Completed Suicide. A Taxonomic Analysis of Clinical and
Social Data', Psychological Medicine. Vol 6 pp. 429 - 438.
Charron, M. (2012). Neighbourhood characteristics and the distribution of crime in Toronto: Additional analysis
on youth crime. Crime and Justice Research Paper Series. Ottawa, ON: Statistics Canada.
Faris, R.E.L. and Dunham, H.W (1939). Mental Disorders in Urban Areas. Chicago: University of
Chicago Press.
Gana, R. N. (1996). “A Comparative Analysis of Development Control Implementation in Minna and Bida,
Niger State” (Unpublished Ph. D Dissertation) Department of Geography, University of Ilorin, Nigeria pp 87-
106.
Herbert, D.T. and Johnston, R.J. (1978). Social Areas as Sampling Framework or Social Survey. Town Planning
Review 45(1) pp171-188
Mabogunje, A.L (1968). Urbanization in Nigeria. London University Press.
Melbourne Institute of Applied Economic and Social Research
National Population Commission (1991). Population Census, Lagos. Federal Government Press
National Population Commission (2010). Federal Republic of Nigeria 2006 Population and Housing Census,
Abuja. Federal Government Press.
Okewole, I. A. (1977). An Approach to Integration between the Tradition and Contemporary Areas of
Ogbomoso. (Unpublished Master thesis), Department of Urban and Regional Planning Ahmadu Bello University,
Zaria, Nigeria.
Onokerhoraye, A.G. and Omuta, G.E.D. (1986). Residential Areas of the City. The Geography and Planning
Series. University of Benin, Nigeria pp 651-657.
Onibokun, A.G. (1972). Nigerian Cities. Their Rehabilitation and Residential Redevelopment
Journal of Royal Town Planning Institute 58 (2) pp.5-56.
Philip, J. C. (2008). Assessing Urban Crime and Its Control. An Overview. National Bureau of Economic
Research (NBER) Working Paper No. 13781 and Terry Standaford Institute of Public Policy, Duke University,
Durham NC 27708
Shaw, C. D. and McKay, H. (1942). (Revised 1969) Juvenile Deliquency and Urban Areas.
Chicago.:University of Chicago Press.
Research on Humanities and Social Sciences www.iiste.org
ISSN 2222-1719 (Paper) ISSN 2222-2863 (Online)
Vol.3, No.10, 2013
102
Wikipedia, the Free Encyclopedia (2013)
Table 1: Selected Localities in Ibadan.
S/N Local Government
Areas
No of
Questionnaire
administered
Residential
Zones
Localities
1 Ibadan North 77 High Yemetu, Oke Aremo, Oje, Itu Taba
52 Medium Mokola and Total Garden,
25 Low New Bodija
2 Ibadan North east 71 High Ode Aje, Beyerunka and Ita Bale Labo
47 Medium Iwo Road and Orita Basorun
24 Low Agodi
3 Ibadan South east 83 High Elekuro, Odinjo and Idi Arere
55 Medium Orita-Challenge and part of Yejide
27 Low Part of Felele
4 Ibadan South west 67 High Foko, Gege, Bode and Popoyemoja
44 Medium Odo-Ona and Oke-Bola.
22 Low Oluyole Estate
5 Ibadan North west 38 High Agbeni/Agbaje, Idikan and Abebi
26 Medium Eleyele
13 Low Onireke GRA
Total 671
Source: Author’s, 2010
Table 2: Categories of Crime
S/N Crime Category Crime Types
1 Crime of acquisition Armed robbery, robbery, car snatching, theft and other stealing,
house breaking, store/shop breaking, school breaking, forcible
entry, burglary, gambling, demanding with menace, suspected
stolen vehicle, procuration of minor gift, other property related
offenses, foreign exchange, cyber crime.
2 Crime of stealth/pretence False pretence, mischief, cheating , unlawful possession, receiving
stolen property, being in possession,
3 Crime of aggression Murder, attempted murder, manslaughter, kidnapping, child
stealing, abduction, homicide, suicide, attempted suicide, slave
dealing, threatening violence, and other offenses against persons,
4 Crime of assaults Grievous harm/wounding, assault occasioning harm, assault,
intimidation, intentional insult, deformation of character
5 Crime against morality and
custom
Rape, attempt to commit rape, indecent assault, enticing, defilement
6 Crime against property Arsons, destruction of property, fire incidence
7 Crime of public disorderliness Breach of peace, affray, public unrest, riot, inciting disturbance,
obstruction, trespass, conspiracy/breach of trust
8 White collar crime Perjury, coining offenses, forgery of currency notes, forgery,
bribery, corruption, misappropriation, impersonation,
examination/election malpractices
9 Crime against public law and
regulations
Escape from lawful custody, resisting arrest
10 Unnatural crime Unnatural offenses, occultic/witchcraft
trial by ordeal, sudden & unnatural death
Source: Author’s 2010.
Research on Humanities and Social Sciences www.iiste.org
ISSN 2222-1719 (Paper) ISSN 2222-2863 (Online)
Vol.3, No.10, 2013
103
Table 3: Intra-city Variation in Average Residential Crime Experienced by Households
Residential
Area
Number of crime
experienced (RCM)
Proportion of
RCM (%)
Number of
Respondents (N)
ARCE =
RCM/N
Intra-city
Deviation
= ARCE - *
Low 767 13.2 111 6.9 -2
Medium 2066 35.5 224 9.2 0.3
High 2983 51.3 319 9.4 0.5
Total 5816 100 654 8.9*
Source: Author’s, 2010
Note: figures with * is the city ARCE, that is average crime experienced by a household within six months
Table 4: Crime Categories in Ibadan
S/N Crime Category Residential Densities
Low (%) Medium (%) High (%) Total (%)
1 Crime of acquisition 341 (44.5) 1383 (66.9) 1722 (57.7) 3446 (59.3)
2 Crime of stealth/pretence 64 (8.3) 112 (5.4) 38 (1.3) 214 (3.7)
3 Crime of aggression 34 (4.4) 31 (1.5) 21 (0.7) 86 (1.5)
4 Crime of assaults 77 (10.0) 99 (4.8) 74 (2.5) 250 (0.04)
5 Crime against morality and
custom 28 (3.7) 39 (1.9) 48 (1.6) 115 (1.9)
6 Crime against property 20 (2.6) 17 (0.8) 22 (0.7) 59 (1.0)
7 Crime of public disorderliness 82 (10.7) 141 (6.8) 718 (24.1) 941 (16.2)
8 White collar crime 96 (12.5) 231 (11.2) 323 (10.8) 650 (21.8)
9 Crime against public law and
order 10 (1.3) 9 (0.4) 9 (0.3) 28 (0.9)
10 Unnatural crime 15 (1.9) 4 (0.2) 8 (0.3) 27 (0.5)
Total (RCM) 767 (13.2) 2066 (35.5) 2983 (51.3) 5816
Source: Author’s, 2010
Note that the proportion is in parenthesis
Table 5: Fear of Crime Events in Ibadan
Events associated with crime
incidence
FCEI for Residential Areas
FCEI FCEI-
*FCEI
(FCEI-
*FCEI)2
Low Medium High
Loss of one's life 1.3 0.9 0.6 0.9 0.1 0.01
‘killing of household member’ 1.4 0.9 0.6 0.9 0.1 0.01
Female member of household raped 1.2 0.8 0.5 0.8 0 0
Self raped 0.9 0.7 0.5 0.7 -0.1 0.01
Kidnapping 0.8 0.7 0.4 0.6 -0.2 0.04
Self tortured or beaten 1.3 1.1 0.6 1.0 0.2 0.04
Female household member tortured
or beaten
1.1 0.9 0.5 0.8 0 0
Infection with HIV/AIDS/other
STD
1.0 0.8 0.5 0.8 0 0
Shock or psychological imbalance 1.81 0.9 0.7 1.1 0.3 0.09
Property carted away 1.81 0.9 0.5 1.1 0.3 0.09
Money stolen 1.6 0.9 0.5 1.0 0.2 0.04
Destruction of window/door locks
and or burglar proof
0.9 0.7 0.9 0.8 0 0
Vandalization of vehicle(s) 0.7 0.6 0.3 0.5 -0.3 0.09
Burning of houses and properties 0.5 0.5 0.3 0.4 -0.4 0.16
Burning of vehicle(s) 0.5 0.5 0.3 0.4 -0.4 0.16
Total 16.81 11.8 7.7 11.8 0.1
*FCEI 1.1 0.8 0.5 0.8
Source: Author’s, 2010
Research on Humanities and Social Sciences
ISSN 2222-1719 (Paper) ISSN 2222-2863 (Online)
Vol.3, No.10, 2013
Figure 1:Study Area within the Context of Oyo State
N
Source: Macmillan Nigeria Secondary Atlas (2006
SAKI WEST
ATISBO
IWAJOWA
IBARAPA NORTH
REPUBLICOFBENIN
O G U N S T A T E
SCALE;1:1 622 222
Kilometres
stealth/pretence, 3.7
aggression, 1.5
assaults, 0.04
against morality
and custom, 1.9
against property, 1
Research on Humanities and Social Sciences
2863 (Online)
104
Figure 1:Study Area within the Context of Oyo State
Source: Macmillan Nigeria Secondary Atlas (2006 )
STUDY AREA State Boundary
SAKI WEST
SAKI EAST
ATISBO
KAJOLA
ITESIWAJU
ATIBA
ORELOPE
OLORUNSOGO
ORIIRE
OYO
EAST
OYO
WEST
ISEYIN
IBARAPA NORTH IBARAPA
EAST
IDO
IBARAPA
CENTRAL
AKINYELE
AFIJIO
IREPO
ONA-ARA
LAGELU
OLUYOLE
EGBEDA
OGBOMOSO
SOUTH SURULERE
OGO-OLUWA
OGBOMOSO
NORTH
K
W
ARA
STATE
K W A R A S T A T E
12
3
4
5
IBADAN NORTH
IBADAN NORTH-WEST
IBADAN SOUTH-WEST
IBADAN SOUTH-EAST
IBADAN NORTH-EAST
1
2
3
4
5
Local Govt. Boundary International Boundary
acquisition, 59.3
stealth/pretence, 3.7
aggression, 1.5
assaults, 0.04
public disorderliness,
16.2
White collar
crime, 21.8
against public law and
order, 0.9
Unnatural crime, 0.5
Figure 2 : Categories of Crime in Ibadan (%)
www.iiste.org
acquisition, 59.3
Unnatural crime, 0.5
Figure 2 : Categories of Crime in Ibadan (%)
This academic article was published by The International Institute for Science,
Technology and Education (IISTE). The IISTE is a pioneer in the Open Access
Publishing service based in the U.S. and Europe. The aim of the institute is
Accelerating Global Knowledge Sharing.
More information about the publisher can be found in the IISTE’s homepage:
http://www.iiste.org
CALL FOR PAPERS
The IISTE is currently hosting more than 30 peer-reviewed academic journals and
collaborating with academic institutions around the world. There’s no deadline for
submission. Prospective authors of IISTE journals can find the submission
instruction on the following page: http://www.iiste.org/Journals/
The IISTE editorial team promises to the review and publish all the qualified
submissions in a fast manner. All the journals articles are available online to the
readers all over the world without financial, legal, or technical barriers other than
those inseparable from gaining access to the internet itself. Printed version of the
journals is also available upon request of readers and authors.
IISTE Knowledge Sharing Partners
EBSCO, Index Copernicus, Ulrich's Periodicals Directory, JournalTOCS, PKP Open
Archives Harvester, Bielefeld Academic Search Engine, Elektronische
Zeitschriftenbibliothek EZB, Open J-Gate, OCLC WorldCat, Universe Digtial
Library , NewJour, Google Scholar

Mais conteúdo relacionado

Semelhante a Residential differentials in incidence and fear of crime perception in ibadan

2-72-1474883509-19. IJANS- ASSESSMENT OF FAITHBASED CRIME PREVENTIVE (1)
2-72-1474883509-19. IJANS- ASSESSMENT OF FAITHBASED CRIME PREVENTIVE (1)2-72-1474883509-19. IJANS- ASSESSMENT OF FAITHBASED CRIME PREVENTIVE (1)
2-72-1474883509-19. IJANS- ASSESSMENT OF FAITHBASED CRIME PREVENTIVE (1)
Akinbami Babatunde
 
Research Methods Final Paper Jay
Research Methods Final Paper JayResearch Methods Final Paper Jay
Research Methods Final Paper Jay
Jay Bhargava
 
Vanessa Schoening February 13, 2014Module 2 .docx
 Vanessa Schoening      February 13, 2014Module 2 .docx Vanessa Schoening      February 13, 2014Module 2 .docx
Vanessa Schoening February 13, 2014Module 2 .docx
MARRY7
 
Crimes and Insecurity in the cityNameProfessor.docx
Crimes and Insecurity in the cityNameProfessor.docxCrimes and Insecurity in the cityNameProfessor.docx
Crimes and Insecurity in the cityNameProfessor.docx
vanesaburnand
 
The Link between Rural-Urban Migration of Youth and Crime in Anyigba Town, Ko...
The Link between Rural-Urban Migration of Youth and Crime in Anyigba Town, Ko...The Link between Rural-Urban Migration of Youth and Crime in Anyigba Town, Ko...
The Link between Rural-Urban Migration of Youth and Crime in Anyigba Town, Ko...
AI Publications
 
Residents’ perception on environmental impacts of urban informal enterprises ...
Residents’ perception on environmental impacts of urban informal enterprises ...Residents’ perception on environmental impacts of urban informal enterprises ...
Residents’ perception on environmental impacts of urban informal enterprises ...
Alexander Decker
 

Semelhante a Residential differentials in incidence and fear of crime perception in ibadan (20)

2-72-1474883509-19. IJANS- ASSESSMENT OF FAITHBASED CRIME PREVENTIVE (1)
2-72-1474883509-19. IJANS- ASSESSMENT OF FAITHBASED CRIME PREVENTIVE (1)2-72-1474883509-19. IJANS- ASSESSMENT OF FAITHBASED CRIME PREVENTIVE (1)
2-72-1474883509-19. IJANS- ASSESSMENT OF FAITHBASED CRIME PREVENTIVE (1)
 
Generating the Trends and Forecast of Crime Rates in Ozamiz City, Philippines
Generating the Trends and Forecast of Crime Rates in Ozamiz City, Philippines Generating the Trends and Forecast of Crime Rates in Ozamiz City, Philippines
Generating the Trends and Forecast of Crime Rates in Ozamiz City, Philippines
 
Research Methods Final Paper Jay
Research Methods Final Paper JayResearch Methods Final Paper Jay
Research Methods Final Paper Jay
 
Nature and Patterns of Urban Crimes With Special Reference to Colombo City in...
Nature and Patterns of Urban Crimes With Special Reference to Colombo City in...Nature and Patterns of Urban Crimes With Special Reference to Colombo City in...
Nature and Patterns of Urban Crimes With Special Reference to Colombo City in...
 
The Relationship Rural Development and Crimes
The Relationship Rural Development and CrimesThe Relationship Rural Development and Crimes
The Relationship Rural Development and Crimes
 
Psychosocial Consequences of Crime on Prisoners in Anywaa Zone Prison Center,...
Psychosocial Consequences of Crime on Prisoners in Anywaa Zone Prison Center,...Psychosocial Consequences of Crime on Prisoners in Anywaa Zone Prison Center,...
Psychosocial Consequences of Crime on Prisoners in Anywaa Zone Prison Center,...
 
EC831 Project "Does More Immigration Lead to More Crime?"
EC831 Project "Does More Immigration Lead to More Crime?"EC831 Project "Does More Immigration Lead to More Crime?"
EC831 Project "Does More Immigration Lead to More Crime?"
 
Crime and Anomic Behavior
Crime and Anomic BehaviorCrime and Anomic Behavior
Crime and Anomic Behavior
 
Working Paper
Working PaperWorking Paper
Working Paper
 
Analysis of the Factors Affecting Violent Crime Rates in the US
Analysis of the Factors Affecting Violent Crime Rates in the USAnalysis of the Factors Affecting Violent Crime Rates in the US
Analysis of the Factors Affecting Violent Crime Rates in the US
 
Vanessa Schoening February 13, 2014Module 2 .docx
 Vanessa Schoening      February 13, 2014Module 2 .docx Vanessa Schoening      February 13, 2014Module 2 .docx
Vanessa Schoening February 13, 2014Module 2 .docx
 
Corruption in Nigeria?Removing the Psychological and Ethical Connections thro...
Corruption in Nigeria?Removing the Psychological and Ethical Connections thro...Corruption in Nigeria?Removing the Psychological and Ethical Connections thro...
Corruption in Nigeria?Removing the Psychological and Ethical Connections thro...
 
Pandemic, Social Unrest, and Crime in U.S. Cities: 2020 Year-End Update
Pandemic, Social Unrest, and Crime in U.S. Cities: 2020 Year-End UpdatePandemic, Social Unrest, and Crime in U.S. Cities: 2020 Year-End Update
Pandemic, Social Unrest, and Crime in U.S. Cities: 2020 Year-End Update
 
Violent Crimes Report for Continental U.S. (1980 - 2009)
Violent Crimes Report for Continental U.S. (1980 - 2009)Violent Crimes Report for Continental U.S. (1980 - 2009)
Violent Crimes Report for Continental U.S. (1980 - 2009)
 
Crimes and Insecurity in the cityNameProfessor.docx
Crimes and Insecurity in the cityNameProfessor.docxCrimes and Insecurity in the cityNameProfessor.docx
Crimes and Insecurity in the cityNameProfessor.docx
 
The Link between Rural-Urban Migration of Youth and Crime in Anyigba Town, Ko...
The Link between Rural-Urban Migration of Youth and Crime in Anyigba Town, Ko...The Link between Rural-Urban Migration of Youth and Crime in Anyigba Town, Ko...
The Link between Rural-Urban Migration of Youth and Crime in Anyigba Town, Ko...
 
Increase Wave of Violent Crime and Insecurity: A Threat to Socio-Economic Dev...
Increase Wave of Violent Crime and Insecurity: A Threat to Socio-Economic Dev...Increase Wave of Violent Crime and Insecurity: A Threat to Socio-Economic Dev...
Increase Wave of Violent Crime and Insecurity: A Threat to Socio-Economic Dev...
 
Cartographic school
Cartographic schoolCartographic school
Cartographic school
 
IJSRED-V2I3P105
IJSRED-V2I3P105IJSRED-V2I3P105
IJSRED-V2I3P105
 
Residents’ perception on environmental impacts of urban informal enterprises ...
Residents’ perception on environmental impacts of urban informal enterprises ...Residents’ perception on environmental impacts of urban informal enterprises ...
Residents’ perception on environmental impacts of urban informal enterprises ...
 

Mais de Alexander Decker

Abnormalities of hormones and inflammatory cytokines in women affected with p...
Abnormalities of hormones and inflammatory cytokines in women affected with p...Abnormalities of hormones and inflammatory cytokines in women affected with p...
Abnormalities of hormones and inflammatory cytokines in women affected with p...
Alexander Decker
 
A usability evaluation framework for b2 c e commerce websites
A usability evaluation framework for b2 c e commerce websitesA usability evaluation framework for b2 c e commerce websites
A usability evaluation framework for b2 c e commerce websites
Alexander Decker
 
A universal model for managing the marketing executives in nigerian banks
A universal model for managing the marketing executives in nigerian banksA universal model for managing the marketing executives in nigerian banks
A universal model for managing the marketing executives in nigerian banks
Alexander Decker
 
A unique common fixed point theorems in generalized d
A unique common fixed point theorems in generalized dA unique common fixed point theorems in generalized d
A unique common fixed point theorems in generalized d
Alexander Decker
 
A trends of salmonella and antibiotic resistance
A trends of salmonella and antibiotic resistanceA trends of salmonella and antibiotic resistance
A trends of salmonella and antibiotic resistance
Alexander Decker
 
A transformational generative approach towards understanding al-istifham
A transformational  generative approach towards understanding al-istifhamA transformational  generative approach towards understanding al-istifham
A transformational generative approach towards understanding al-istifham
Alexander Decker
 
A time series analysis of the determinants of savings in namibia
A time series analysis of the determinants of savings in namibiaA time series analysis of the determinants of savings in namibia
A time series analysis of the determinants of savings in namibia
Alexander Decker
 
A therapy for physical and mental fitness of school children
A therapy for physical and mental fitness of school childrenA therapy for physical and mental fitness of school children
A therapy for physical and mental fitness of school children
Alexander Decker
 
A theory of efficiency for managing the marketing executives in nigerian banks
A theory of efficiency for managing the marketing executives in nigerian banksA theory of efficiency for managing the marketing executives in nigerian banks
A theory of efficiency for managing the marketing executives in nigerian banks
Alexander Decker
 
A systematic evaluation of link budget for
A systematic evaluation of link budget forA systematic evaluation of link budget for
A systematic evaluation of link budget for
Alexander Decker
 
A synthetic review of contraceptive supplies in punjab
A synthetic review of contraceptive supplies in punjabA synthetic review of contraceptive supplies in punjab
A synthetic review of contraceptive supplies in punjab
Alexander Decker
 
A synthesis of taylor’s and fayol’s management approaches for managing market...
A synthesis of taylor’s and fayol’s management approaches for managing market...A synthesis of taylor’s and fayol’s management approaches for managing market...
A synthesis of taylor’s and fayol’s management approaches for managing market...
Alexander Decker
 
A survey paper on sequence pattern mining with incremental
A survey paper on sequence pattern mining with incrementalA survey paper on sequence pattern mining with incremental
A survey paper on sequence pattern mining with incremental
Alexander Decker
 
A survey on live virtual machine migrations and its techniques
A survey on live virtual machine migrations and its techniquesA survey on live virtual machine migrations and its techniques
A survey on live virtual machine migrations and its techniques
Alexander Decker
 
A survey on data mining and analysis in hadoop and mongo db
A survey on data mining and analysis in hadoop and mongo dbA survey on data mining and analysis in hadoop and mongo db
A survey on data mining and analysis in hadoop and mongo db
Alexander Decker
 
A survey on challenges to the media cloud
A survey on challenges to the media cloudA survey on challenges to the media cloud
A survey on challenges to the media cloud
Alexander Decker
 
A survey of provenance leveraged
A survey of provenance leveragedA survey of provenance leveraged
A survey of provenance leveraged
Alexander Decker
 
A survey of private equity investments in kenya
A survey of private equity investments in kenyaA survey of private equity investments in kenya
A survey of private equity investments in kenya
Alexander Decker
 
A study to measures the financial health of
A study to measures the financial health ofA study to measures the financial health of
A study to measures the financial health of
Alexander Decker
 

Mais de Alexander Decker (20)

Abnormalities of hormones and inflammatory cytokines in women affected with p...
Abnormalities of hormones and inflammatory cytokines in women affected with p...Abnormalities of hormones and inflammatory cytokines in women affected with p...
Abnormalities of hormones and inflammatory cytokines in women affected with p...
 
A validation of the adverse childhood experiences scale in
A validation of the adverse childhood experiences scale inA validation of the adverse childhood experiences scale in
A validation of the adverse childhood experiences scale in
 
A usability evaluation framework for b2 c e commerce websites
A usability evaluation framework for b2 c e commerce websitesA usability evaluation framework for b2 c e commerce websites
A usability evaluation framework for b2 c e commerce websites
 
A universal model for managing the marketing executives in nigerian banks
A universal model for managing the marketing executives in nigerian banksA universal model for managing the marketing executives in nigerian banks
A universal model for managing the marketing executives in nigerian banks
 
A unique common fixed point theorems in generalized d
A unique common fixed point theorems in generalized dA unique common fixed point theorems in generalized d
A unique common fixed point theorems in generalized d
 
A trends of salmonella and antibiotic resistance
A trends of salmonella and antibiotic resistanceA trends of salmonella and antibiotic resistance
A trends of salmonella and antibiotic resistance
 
A transformational generative approach towards understanding al-istifham
A transformational  generative approach towards understanding al-istifhamA transformational  generative approach towards understanding al-istifham
A transformational generative approach towards understanding al-istifham
 
A time series analysis of the determinants of savings in namibia
A time series analysis of the determinants of savings in namibiaA time series analysis of the determinants of savings in namibia
A time series analysis of the determinants of savings in namibia
 
A therapy for physical and mental fitness of school children
A therapy for physical and mental fitness of school childrenA therapy for physical and mental fitness of school children
A therapy for physical and mental fitness of school children
 
A theory of efficiency for managing the marketing executives in nigerian banks
A theory of efficiency for managing the marketing executives in nigerian banksA theory of efficiency for managing the marketing executives in nigerian banks
A theory of efficiency for managing the marketing executives in nigerian banks
 
A systematic evaluation of link budget for
A systematic evaluation of link budget forA systematic evaluation of link budget for
A systematic evaluation of link budget for
 
A synthetic review of contraceptive supplies in punjab
A synthetic review of contraceptive supplies in punjabA synthetic review of contraceptive supplies in punjab
A synthetic review of contraceptive supplies in punjab
 
A synthesis of taylor’s and fayol’s management approaches for managing market...
A synthesis of taylor’s and fayol’s management approaches for managing market...A synthesis of taylor’s and fayol’s management approaches for managing market...
A synthesis of taylor’s and fayol’s management approaches for managing market...
 
A survey paper on sequence pattern mining with incremental
A survey paper on sequence pattern mining with incrementalA survey paper on sequence pattern mining with incremental
A survey paper on sequence pattern mining with incremental
 
A survey on live virtual machine migrations and its techniques
A survey on live virtual machine migrations and its techniquesA survey on live virtual machine migrations and its techniques
A survey on live virtual machine migrations and its techniques
 
A survey on data mining and analysis in hadoop and mongo db
A survey on data mining and analysis in hadoop and mongo dbA survey on data mining and analysis in hadoop and mongo db
A survey on data mining and analysis in hadoop and mongo db
 
A survey on challenges to the media cloud
A survey on challenges to the media cloudA survey on challenges to the media cloud
A survey on challenges to the media cloud
 
A survey of provenance leveraged
A survey of provenance leveragedA survey of provenance leveraged
A survey of provenance leveraged
 
A survey of private equity investments in kenya
A survey of private equity investments in kenyaA survey of private equity investments in kenya
A survey of private equity investments in kenya
 
A study to measures the financial health of
A study to measures the financial health ofA study to measures the financial health of
A study to measures the financial health of
 

Último

+971581248768>> SAFE AND ORIGINAL ABORTION PILLS FOR SALE IN DUBAI AND ABUDHA...
+971581248768>> SAFE AND ORIGINAL ABORTION PILLS FOR SALE IN DUBAI AND ABUDHA...+971581248768>> SAFE AND ORIGINAL ABORTION PILLS FOR SALE IN DUBAI AND ABUDHA...
+971581248768>> SAFE AND ORIGINAL ABORTION PILLS FOR SALE IN DUBAI AND ABUDHA...
?#DUbAI#??##{{(☎️+971_581248768%)**%*]'#abortion pills for sale in dubai@
 

Último (20)

Tata AIG General Insurance Company - Insurer Innovation Award 2024
Tata AIG General Insurance Company - Insurer Innovation Award 2024Tata AIG General Insurance Company - Insurer Innovation Award 2024
Tata AIG General Insurance Company - Insurer Innovation Award 2024
 
GenAI Risks & Security Meetup 01052024.pdf
GenAI Risks & Security Meetup 01052024.pdfGenAI Risks & Security Meetup 01052024.pdf
GenAI Risks & Security Meetup 01052024.pdf
 
Polkadot JAM Slides - Token2049 - By Dr. Gavin Wood
Polkadot JAM Slides - Token2049 - By Dr. Gavin WoodPolkadot JAM Slides - Token2049 - By Dr. Gavin Wood
Polkadot JAM Slides - Token2049 - By Dr. Gavin Wood
 
🐬 The future of MySQL is Postgres 🐘
🐬  The future of MySQL is Postgres   🐘🐬  The future of MySQL is Postgres   🐘
🐬 The future of MySQL is Postgres 🐘
 
How to Troubleshoot Apps for the Modern Connected Worker
How to Troubleshoot Apps for the Modern Connected WorkerHow to Troubleshoot Apps for the Modern Connected Worker
How to Troubleshoot Apps for the Modern Connected Worker
 
Automating Google Workspace (GWS) & more with Apps Script
Automating Google Workspace (GWS) & more with Apps ScriptAutomating Google Workspace (GWS) & more with Apps Script
Automating Google Workspace (GWS) & more with Apps Script
 
+971581248768>> SAFE AND ORIGINAL ABORTION PILLS FOR SALE IN DUBAI AND ABUDHA...
+971581248768>> SAFE AND ORIGINAL ABORTION PILLS FOR SALE IN DUBAI AND ABUDHA...+971581248768>> SAFE AND ORIGINAL ABORTION PILLS FOR SALE IN DUBAI AND ABUDHA...
+971581248768>> SAFE AND ORIGINAL ABORTION PILLS FOR SALE IN DUBAI AND ABUDHA...
 
A Year of the Servo Reboot: Where Are We Now?
A Year of the Servo Reboot: Where Are We Now?A Year of the Servo Reboot: Where Are We Now?
A Year of the Servo Reboot: Where Are We Now?
 
Apidays New York 2024 - Scaling API-first by Ian Reasor and Radu Cotescu, Adobe
Apidays New York 2024 - Scaling API-first by Ian Reasor and Radu Cotescu, AdobeApidays New York 2024 - Scaling API-first by Ian Reasor and Radu Cotescu, Adobe
Apidays New York 2024 - Scaling API-first by Ian Reasor and Radu Cotescu, Adobe
 
Apidays New York 2024 - The Good, the Bad and the Governed by David O'Neill, ...
Apidays New York 2024 - The Good, the Bad and the Governed by David O'Neill, ...Apidays New York 2024 - The Good, the Bad and the Governed by David O'Neill, ...
Apidays New York 2024 - The Good, the Bad and the Governed by David O'Neill, ...
 
Workshop - Best of Both Worlds_ Combine KG and Vector search for enhanced R...
Workshop - Best of Both Worlds_ Combine  KG and Vector search for  enhanced R...Workshop - Best of Both Worlds_ Combine  KG and Vector search for  enhanced R...
Workshop - Best of Both Worlds_ Combine KG and Vector search for enhanced R...
 
The 7 Things I Know About Cyber Security After 25 Years | April 2024
The 7 Things I Know About Cyber Security After 25 Years | April 2024The 7 Things I Know About Cyber Security After 25 Years | April 2024
The 7 Things I Know About Cyber Security After 25 Years | April 2024
 
HTML Injection Attacks: Impact and Mitigation Strategies
HTML Injection Attacks: Impact and Mitigation StrategiesHTML Injection Attacks: Impact and Mitigation Strategies
HTML Injection Attacks: Impact and Mitigation Strategies
 
AWS Community Day CPH - Three problems of Terraform
AWS Community Day CPH - Three problems of TerraformAWS Community Day CPH - Three problems of Terraform
AWS Community Day CPH - Three problems of Terraform
 
MINDCTI Revenue Release Quarter One 2024
MINDCTI Revenue Release Quarter One 2024MINDCTI Revenue Release Quarter One 2024
MINDCTI Revenue Release Quarter One 2024
 
Exploring the Future Potential of AI-Enabled Smartphone Processors
Exploring the Future Potential of AI-Enabled Smartphone ProcessorsExploring the Future Potential of AI-Enabled Smartphone Processors
Exploring the Future Potential of AI-Enabled Smartphone Processors
 
Strategies for Landing an Oracle DBA Job as a Fresher
Strategies for Landing an Oracle DBA Job as a FresherStrategies for Landing an Oracle DBA Job as a Fresher
Strategies for Landing an Oracle DBA Job as a Fresher
 
Apidays Singapore 2024 - Building Digital Trust in a Digital Economy by Veron...
Apidays Singapore 2024 - Building Digital Trust in a Digital Economy by Veron...Apidays Singapore 2024 - Building Digital Trust in a Digital Economy by Veron...
Apidays Singapore 2024 - Building Digital Trust in a Digital Economy by Veron...
 
Connector Corner: Accelerate revenue generation using UiPath API-centric busi...
Connector Corner: Accelerate revenue generation using UiPath API-centric busi...Connector Corner: Accelerate revenue generation using UiPath API-centric busi...
Connector Corner: Accelerate revenue generation using UiPath API-centric busi...
 
Manulife - Insurer Innovation Award 2024
Manulife - Insurer Innovation Award 2024Manulife - Insurer Innovation Award 2024
Manulife - Insurer Innovation Award 2024
 

Residential differentials in incidence and fear of crime perception in ibadan

  • 1. Research on Humanities and Social Sciences www.iiste.org ISSN 2222-1719 (Paper) ISSN 2222-2863 (Online) Vol.3, No.10, 2013 96 Residential Differentials in Incidence and Fear of Crime Perception in Ibadan Adigun, Folasade Oyenike Department of Urban and Regional Planning, Ladoke Akintola University of Technology, Ogbomoso foadigun@lautech.edu.ng Abstract The paper examines crime experienced by residents and the fear of crime events in residential areas of Ibadan. It was observed that households of the high and medium densities have higher average residential crime experience (ARCE) than average crime experienced by any household in Ibadan while households in the low density residential area have a lower ARCE. Findings on fear of crime indicate that the low density residential area has the highest mean FCEI value (1.1) followed by the medium (0.8) then the high density (0.5). The pattern of fear of crime events (FCEI) observed in Ibadan is a reverse of the pattern of residential crime magnitude (RCM) and average crime experienced (ARCE) among the three residential areas. The study suggests that strategies of dealing with crime and its fear should be done in collaboration with local communities so as to reflect the experiences and concerns of residents. Keywords: crime, events, fear, residential area 1. Introduction The problem of skyrocketing, daunting and seemingly untameable urban crime has become a nerve-racking phenomenon to all and sundry. The consequences of crime are evident on the residents, quality of life and the liveability of cities. This manifests in the loss of investment, lives and properties. Coupled with these is the resulting conducive terrain for strengthening of deeply rooted crime cultures and other socio- economic implications on the residents and image of cities. Besides, there are countless emotional consequences of crime on human beings; chief among which is fear and insecurity. Fear has been regarded as the immediate ‘within’ (or internal) response that poses threat to human safety (Afon 2001). Fear of crime is conceived to arise from concern about crime, the consequences of victimization, the probability of being victimized, feelings of vulnerability and wider social and situational influences (Department of Justice, Equality and Law Reform 2009). Several factors influence fear of crime. These are: gender, age, nationality, marital status, education level, locality, official crime rate, perception of crime in local area, prior experience of victimization among others (Department of Justice, Equality and Law Reform 2009). Repeatedly in the literature, studies of fear of crime point to a paradox that those groups that expressed the highest level of fear of crime typically have the lowest victimization rates (Stafford & Galle 1984). Women and the elderly are more fearful of crime while better educated and prosperous people are less fearful of crime (Melbourne Institute of Applied Economic and Social Research). While fear of crime can be differentiated into public feelings, thoughts and behaviours about the personal risk of criminal victimization, distinctions can also be made between the tendency to see situations as fearful, the actual experience while in those situations, and broader expressions about the cultural and social significance of crime and symbols of crime in people's neighbourhoods and in their daily symbolic lives (Encyclopaedia). Crimes and its consequences occur not only within, but are also influenced and may indeed be compounded by a wide range socio-economic and environmental context, summarized in urban residential patterns (Faris & Dunham 1939; Shaw & McKay 1942; Bagley et al 1976; Aguda 1994; Agbola 1997; Afon 2001; Phillip 2008, Adigun 2012). For instance in the study carried out by Shaw & McKay (1942) in the city of Chicago, it was documented that juvenile delinquency conforms to a regular spatial pattern in Chicago; with the highest rates at the inner-city zones (i.e. around the central business district) and a declining rate with increasing distance from the centre. Thus the areas with low delinquency are located mostly near the city’s periphery. Afon (2001) in his analyses of occurrence of criminal activities in Ilorin found that all categories of crime investigated occurred in the high density area. Nonetheless, some criminal activities are peculiar to certain densities with different degrees of incidence. This is attributed to varying social and economic attributes of the residents as well as the environmental characteristics of the residential areas in Ilorin. 'House breaking' was observed to be more in the low density area than in the remaining two densities. This supports earlier findings of Aguda (1994). Using residential densities as basis for data collection, Agbola (1997) explored the impact of the increasing urban violence in Nigerian cities on physical planning, urban design and building construction practices. Among cases reviewed, the incidence of burglary and other crimes such as armed robbery, loitering, street fighting, hooliganism, prostitution, drug dealing and gambling are found to be more in the high density (22.11percent) and
  • 2. Research on Humanities and Social Sciences www.iiste.org ISSN 2222-1719 (Paper) ISSN 2222-2863 (Online) Vol.3, No.10, 2013 97 decreases through the medium (19.49 percent) to the low (16.99 percent) density residential areas. The highest incidence of urban violence is robbery with 47.37 percent followed by burglary with 32.02 percent. The number of victims of urban violence is more in the high density residential. The highest proportion of lives lost to urban violence is recorded at the low density residential areas. Abodunrin (2004) reported a similar pattern of crime distribution in Ogbomoso. The high density residential areas had the highest crime incidence (47.2 percent) within the period studied while 34.7 percent and 18.1 percent crime cases were recorded in the medium and low density residential areas. In the same vein, it was observed that youth crime has spatial implication in Toronto (Charron 2012). Most of Toronto’s police-reported incidents of youth crime took place in an outdoor public space (33%) or commercial establishment (32%). The study identified more youth crimes in places that are more easily accessible to them and where there is less social control. These studies conclusively demonstrate that first, there are notable geographical variations in the patterning of crime locations and secondly, these variations differ in regards to type of crime. The current study does not only investigate the occurrence of crime in each residential density using residents' declaration of crime incidence but also the fear of events associated with criminal incidences. Consequent upon the established relationship between crime and residential area the data for this study was collected based on residential zones. According to Afon (2005) the use of urban residential zones has been considered a reliable basis for the collection of primary data for the subsequent reasons (Hebert & Johnston 1978; Gana 1996). First, residential zones in urban centres tend to show more permanent geographical attributes in terms of locations, structures, housing types, commercial activities etc. Secondly, these permanent geographical attributes objectively represent the social, economic and cultural attributes of the residents (Herbert & Johnson, 1978). Thirdly each residential zone is likely to internally contain residents’ that have homogeneous social and economic characteristics (Gana 1996). Fourthly, by grouping urban centre into residential zones the analysis of who live in each, the crime experienced and fear of same in each group is relatively simplified. The study therefore examines the incidence of crime and residents’ level of fear of associated events within the context of residential neighbourhoods in Ibadan with a view to establishing a link between incidence and fear of crime. 2. Study Area Ibadan is located approximately on longitude 30 51 East of the Greenwich meridian and latitude 70 231 North of the equator at a distance of 145 kilometers north east of Lagos. Ibadan region is described as an area extending for about 55km from Asejire in the East to Agemo in the West and for about 700km from Iroko in the north to Mamu in the South (Akinola 1963 cited by Akintola (1994). The city was founded in the 1820s (Mabogunje 1968). Ibadan city is one of the Yoruba traditional urban centres whose urbanization predates colonialism. The city grew from a population size of 200,000 souls in 1890 to 175,000 in 1911, 238,075 in 1921, 459,196 in 1952, and 1,783,962 in 1981 (Mabogunje 1968 and Ayeni 1994) to 1,338,659 in 2006 (NPC, 2006). Ibadan is made up of eleven local government areas, out of which five are found in the inner city surrounded by the remaining six local government areas. This comprises of Ibadan North, Ibadan North east Ibadan, Ibadan North west, Ibadan South east, Ibadan South west, Akinyele, Lagelu, Egbeda, Ona-Ara, Oluyole and Ido. Ibadan is directly connected to many urban centres and their rural hinterland by system of roads, railways and air routes. 3. Research Methodology The study utilized primary data obtained through questionnaire administered to residents. Information obtained includes residents’ socioeconomic characteristics, household crime experienced within six months and level of fear of crime. Five local government areas of Ibadan formed the sampling frame. These include Ibadan north, Ibadan north east, Ibadan northwest, Ibadan south east and Ibadan south west. These are referred to as the inner LGAs of Ibadan. Localities within the three distinct residential areas were identified. Previous research efforts identified three major categories of residential areas which are distinct in social as well as physical attributes (Onokerhoraye & Omuta, 1986; Afon 2004). These are: low quality residential area usually (high density residential zone); medium quality residential area (medium density residential zone) and high quality residential area (low density residential zone). In modern urban centres residential density is described in terms of floor area ratio and population. In traditional urban centre traditional/core, transitional and suburban residential areas represent the three residential areas highlighted above (Onibokun 1972). According to Okewole (1977) historically, the traditional core area is a pre-colonial development occupied by indigenous population and or the early settlers. This area is often found in the heart of the city (Onerkerhoraye & Omuta, 1985). The transitional residential area developed during the colonial era forms the next layer of development. The sub- urban/low density residential area could be pre and post independence developments. In cities of this nature socio- economic characteristics (such as level of education, occupation and income) and environmental quality are considered to vary inversely with density. These features were used in identifying the three residential areas.
  • 3. Research on Humanities and Social Sciences www.iiste.org ISSN 2222-1719 (Paper) ISSN 2222-2863 (Online) Vol.3, No.10, 2013 98 The study employed a multi stage sampling technique. The random and systematic sampling techniques were used within the context of already stratified local government areas and the three residential zones. The first level of stratification was done on the basis of the delineated local government areas. The second level of stratification was based on identified residential areas. Localities with the features of the three residential areas were identified in each local government area and purposively selected for the study. The first building in each randomly selected street was chosen at the discretion of the researcher. Subsequent selection was done at an interval of ten buildings. To cater for residents in landlocked portions of the core area where buildings are not accessible by roads, buildings were selected at uniform interval of every five building off the roads. The target population are the residents. A household was selected from each chosen building from where a resident not less than 18 years either male or female was sampled. The selected residents were investigated using a structured questionnaire. A total of 654 copies of the questionnaire out of the 671 distributed were considered useful for the analysis. This represent 97.47 percent recovery rate. Data analysis was mainly descriptive. Three indices were developed in this study. These are ‘Residential Crime Magnitude’ (RCM), ‘Average Residential Crime Magnitude’ (ARCE) and ‘Fear of Crime Events Index’ (FCEI). The first is the aggregate of crime experienced by households while the second is the average of this aggregate. ARCE was calculated as the mean of RCM. This was done for each residential area and the whole city. The mathematical expression is as follows: ARCE = RCM/N (1) Where :ARCE = Average residential crime magnitude RCM = Residential Crime Magnitude N = Number of respondent The third index measures residents’ level of fear of events associated with crime incidence. Variables indicating FCEI were measured in ranking scale of Likert as “very high” (5), “high”(4), “moderate (3)”, “low”(2) and “very low”(1). The FCEI was obtained by dividing the summation of weighted value (SWV) by the total number of responses. The SWV of each variable is the addition of the product of the proportion of responses to it and the weighted value attached to each rating. This is done for each residential area. The mathematically expression is as follows: FCEI = SWV/Ni (2) SWV = NiVi (3) Where: FCEI = ‘Fear of Crime Events Index’ SWV = Summation of weight value Ni = Number of Respondents rating variable i; and Vi = weight assigned to variable i 4. Results and Discussion 4.1 Crime Incidence in Residential Neighbourhoods The data obtained on crime experienced by residents were summarised into ten categories. This categorization was done based on lessons from previous studies (Tanumo 1991; Sullivian 1996; Omisakin 1998; and Abodunrin 2004) coupled with the intuition of the researcher. Crime types were categorized into ten broad groups (see table 2). 4.2 Intra Urban Variation in Crime Experienced by Households There is significant variation in the value of RCM recorded in the three residential zones (X2 = 1279.04; df =2, table value = 5.991, at 0.05 level of significance). This implies that there is intra-city variation in total number of crime experienced by households in the residential areas. In other words residents of the three residential areas experienced crime differently. The RCM of each residential area was taken as a proportion of the city total and comparison is made among the three residential areas. It was observed that the low density of Ibadan has the least proportion of RCM (13.2%) compared to medium and high densities with 35.5% and 51.3% respectively. Summarily crime experienced by households decreased in magnitude from the high to the medium then the low density residential areas. This finding is not different from what scholars have recorded in previous studies. For instance Agbola (1997) and Afon (2001) observed the most significant level of crime incidence in the high density area of Lagos and Ilorin respectively. Sampsom et al (2002) also stated that disadvantaged neighbourhoods are more criminogenic. This study however argues that the general conception that crime figure is more in the high density residential areas should not be taken religiously without relating it to the population size more so that higher population size in high density residential areas (Adeboyejo & Onyeororu 2003) could account for higher magnitude of crime. This kind of analysis will provide an opportunity to establish the average crime experienced by households in the area.
  • 4. Research on Humanities and Social Sciences www.iiste.org ISSN 2222-1719 (Paper) ISSN 2222-2863 (Online) Vol.3, No.10, 2013 99 4.3 Average Residential Crime Experienced by Households (ARCE) The incidence of crime was taken as a quotient of sample size in each residential area and city. The high density of Ibadan has the highest ARCE of 9.4 followed by the medium and low densities with 9.2 and 6.9 respectively. This implies that average of nine crime incidences are experienced by a single household in the high density residential areas within six months. This may sounds so high but it should be noted that a household has one or more individuals which in many cases are more than six persons in the high density residential areas. The ARCEs obtained for the medium and low density areas can also be interpreted in the same way. The intra-city difference is further illustrated by comparing the residential area ARCE with the city ARCE. It was observed that the high and medium densities of Ibadan have respectively an ARCE value of 0.5 and 0.3 above the city ARCE. Simply put the residents of these areas have higher crime experience than average crime experienced by any household in Ibadan. The low density has -2 below the city ARCE (see table 3). Households in this residential area have a reverse of the experience of the first category. In other words they have a lower crime experience than an average household in the city. Conclusively the residential areas with ARCE figure higher than the city average could be considered more prone to crime than others. This indicates that the high and medium density residential areas are more prone to crime than the low density areas. This pattern conforms to the observations in the literature (Agbola 1997 and Afon 2001; Sampsom et al 2002; Abodunrin 2004). When these crime totals are disaggregated into their respective categories an informative scenario evolved and is documented in the next section. 4.4 Spatial Variation in the Categories of Crime Experienced by Households There is significant intra-city variation in the magnitude of crime categories in the study area (F ratio = 5.606, P value = 0.001, at 0.05 level of significance). This implies that the incidence of different crime category significantly varies from one another among the three residential areas in the study area. The pattern of incidence is similar for certain crime categories such as crime of acquisition, crime against morality and custom, public disorderliness and white collar crime (see table 4). The incidence of these crime categories decreases from the high density to the medium then the low density residential areas. On the other hand crime of stealth/pretence and assaults records highest incidence in the medium density followed by the low then high densities. Within each residential density crime categories however displayed varying patterns. In the high density residential area, the next category after crime of acquisition (57.7%) is crime of public disorderliness (24.1%), white collar crime (10.8%) then assaults (2.5%) and crime against morality and custom (1.6%). White collar crime (11.2%) comes second after crime of acquisition (66.9%) in the medium density leaving stealth/pretence (5.4%) and assaults (4.8%) in the third and fourth position. In descending order of incidence crime categories forms this pattern in the low density area: acquisition (44.5%), white collar crime (12.5%), crime of public disorderliness (10.7%), assaults (10.0%) and stealth/pretence (8.3%). The least occurring category is crime against public law and order in the low density residential area but unnatural crime in the medium and high densities. 4.5 Fear of Crime Events in Ibadan The mean FCEI value for the three residential areas is 0.8 (see table 5). The mostly dreaded crime events are ‘shock/psychological imbalance’ and ‘properties carted away’ with 1.1 each; ‘self torture/beaten’ (1.0); ‘killing of household member’ and loss of one’s life each with 0.9. These events have positive deviation about the city FCEI. On the other hand, events with negative deviation about the city FCEI include self raped (0.7); kidnapping (0.6); vandalization of vehicle (0.5). Other events in this category are burning of house/properties and burning of vehicle each with 0.4. These events could be regarded as less fearful events of crime in the city of Ibadan. Respondents dread these events but not as the ones in the first category. Residents had the same level of fear for some events as the average level of fear of crime events in the city. These are ‘female household member raped’; female household member tortured/beaten, infection with HIV/AIDS/other STD and destruction of window/door locks and or burglar proof each with 0.8. Included in table 5 is the mean FCEI value for each residential area. The low density has the highest mean value (1.1) followed by the medium (0.8) then the high density (0.5). Within the low density, events of crime that residents feared above the average level of fear for all crime events in this area are ‘shock/psychological imbalance’ and ‘‘properties carted away’’ with 1.81 each; money stolen (1.6); ‘killing of household member’ (1.4); loss of one’s life and self tortured/beaten each with 1.3 and female household member raped (1.2). Events that residents fear less include infection with HIV/AIDS/other STD (1.0); self raped and destruction of window/door locks/burglar proof with 0.9 each; kidnapping (0.8) and vandalization of vehicle (0.7). Others are burning of houses/properties and burning of vehicles each with 0.5. The most dreaded events are ‘shock/psychological imbalance’ and ‘‘properties carted away’’ while the least are burning of houses/properties and burning of vehicles. Destruction of properties is of less concern to the rich, some could even use properties as ransom for their lives. But issues that border on their lives and health seems paramount to them presuming that criminals are oftentimes interested in carting away valuables except hired or sponsored killers. Though this
  • 5. Research on Humanities and Social Sciences www.iiste.org ISSN 2222-1719 (Paper) ISSN 2222-2863 (Online) Vol.3, No.10, 2013 100 area had the lowest residential crime magnitude and average crime experienced yet the level of fear of crime events is high. This suggests that there are other factors which influence level of fear of crime events. Information on crime incidences, agitation as well as expectations of eventualities of crime may contribute to this. In the medium density crime events that residents feared above the average level of fear of crime events include self tortured or beaten (1.1); loss of one’s life; ‘killing of household member’; female household member tortured/beaten; ‘‘properties carted away’’ and ‘shock/psychological imbalance’, money stolen each with FCEI value of 0.9. On the other hand residents fear some events below the average level of fear of crime events in the area. These include self raped; kidnapping and money stolen with 0.7 each; vandalization of vehicle (0.6); burning of houses/properties and burning of vehicles with 0.5 each. Female household member raped and infection with HIV/AIDS/other STD had the same FCEI value (0.8) with city and medium density FCEI value. The most and least feared of all crime events understudied is self tortured or beaten and, burning of houses/properties and burning of vehicles respectively. Residents of the high density have high fear for some crime events than average fear of crime events in their area. These include destruction of window/door locks/burglar proof (0.9); ‘shock/psychological imbalance’ (0.7); loss of one’s life; ‘killing of household member’; self tortured/ beaten with 0.6 each. Female household member raped; self raped; female household member tortured/beaten; infection with HIV/AIDS/other STD; property carted away and money stolen have the same FCEI value equivalent of the mean FCEI for this density. Residents have less dread of some crime events than average fear of crime events in the area. These include kidnapping (0.4); vandalization of vehicle; burning of houses/properties and burning of vehicles with 0.3 each. The high density dwellers have high fear of destruction of window/door locks/burglar proof while the least feared is burning of vehicles. Residents may fear the crime events that give way to other crime events or that rendered them more vulnerable to attack. Window/door locks/burglar proof is one of households’ safety measures of common place in our society. The poor has a fear of criminals destroying this security barrier and breaking in, much more that there are less valuables to offer. It was observed that some crime events within the residential areas have FCEI either above or below the mean FCEI of Ibadan. On a general note all the identified crime events in the high density have lower FCEI than Ibadan’s FCEI of 0.8 except destruction of window/door locks and or burglar proof. This implies that residents of the high density of Ibadan had low level of fear for crime events. This is probably due to the nature of the selected localities which are core areas with considerable traditional Yoruba virtues of cohesion, communalism and good neighbourliness all of which discourages anonymity: an enhancing factor for criminality. The medium density has the same FCEI value as the city mean FCEI. Eleven events in the low density have FCEI value above the city FCEI value while three events have FCEI value below it. This is indicative of high level of fear of crime events in the area. The pattern of fear of crime events observed in Ibadan is a reverse of the pattern of residential crime magnitude and average crime experienced among the three residential areas. Fear of crime events is at the lowest ebb in the high density where the highest ARCE was recorded while the low density had a greater level of fear of events associated with crime even though the lowest ARCE was observed. This indicates that there are other factors dictating fear of crime apart from crime experienced though these are not covered by this study. 5.0 Conclusion Residents of the three residential areas of Ibadan experienced crime differently. The high density of Ibadan has the highest average residential crime experienced (ARCE) of 9.4 followed by the medium and low densities with 9.2 and 6.9 respectively. Not only this the incidence of different crime category significantly varies from one another among the three residential areas The pattern of incidence is similar for certain crime categories such as crime of acquisition, crime against morality and custom, public disorderliness and white collar crime. The incidence of these crime categories decreases from the high density to the medium then the low density residential areas. The most dreaded crime events in the study area are ‘shock/psychological imbalance’ and ‘properties carted away’ with 1.1 each; ‘self torture/beaten’ (1.0); ‘killing of household member’ and loss of one’s life each with 0.9. These events have positive deviation about the city FCEI. It was observed that some crime events within the residential areas have FCEI either above or below the mean FCEI of Ibadan. All the identified crime events in the high density have lower FCEI than Ibadan’s FCEI of 0.8 except destruction of window/door locks and or burglar proof. This implies that residents of the high density residential areas of Ibadan had low fear of crime events. The pattern of fear of crime events observed in Ibadan is a reverse of the pattern of residential crime magnitude and average crime experienced among the three residential areas. Fear of crime events is at the lowest ebb in the high density where the highest ARCE was recorded while the low density had a greater level of fear of events associated with crime even though the lowest ARCE was observed. This indicates that there are other
  • 6. Research on Humanities and Social Sciences www.iiste.org ISSN 2222-1719 (Paper) ISSN 2222-2863 (Online) Vol.3, No.10, 2013 101 factors dictating fear of crime apart from crime experienced. Examination of these factors could be a basis for further research work in the study area. In order to further the understanding of the spatial distribution of the subject of discourse, the dichotomy could also be investigated among cities of different sizes as well as between urban and rural areas. The study by examination of the level of fear associated with different crime events has provided an insight into what should be addressed provided or improved in order to enhance liveability in the cities. The results of this research show that incidence and fear of crime has spatial variation, indicating that strategies of dealing with crime and its fear should reflect these differences. Thus, areas with high crime incidence and fear should receive more attention. In addition, intervention in residential areas should be done in collaboration with local communities so as to reflect the experiences and concern of residents. References Abodunrin, F.O. (2004). Spatio-Temporal Variation and Residents Response to Crime in Ogbomoso. M.Tech, Dissertation Department of Urban and Regional Planning, Ladoke Akintola University of Technology. Adigun, F. O. (2012). Spatio-temporal Analysis of Urban Crime in Selected Nigerian Cities. Ph. D dissertation, Department of Urban and Regional Planning, Ladoke Akintola University of Technology, Ogbomoso. Afon, A.O (2001). "Resident Diversity Factor in the Perception of and Response to Fear of Crime in Nigeria". Paper presented at the International Conference on Security, Segregation and Social Networks in West Africa Cities 19'th – 20th centuries, held at the International Centre for African Studies (IFRA) University of Ibadan. Afon, A.O (2005). “Solid Waste Management in Selected Cities of Oyo State, Nigeria. Ph.D submitted to the Department of Urban and Regional Planning, Obafemi Awolowo University. Agbola, Tunde (1997). Architecture of Fear, Urban Design and Construction Response to Urban Violence in Lagos, Nigeria. Ibadan. IFRA. Aguda, A.S. (1994). Area Ecological Analysis of Crime. A Case Study of a Nigerian City. In Albert, I.O, Adisa, J Agbola T. and Herault, G. (eds) Urban Management and Urban Violence in Africa. Vol. 1 pp l-8. Ibadan. IFRA Akinola R.A (1963). “The Ibadan Region.” Nigerian Geographical Journal Vol. 6 pp. 102-15 cited by Akintola, F.O. (1994). Geology and Hydro Geology Filani, M. O., Akintola, F.O. and Ikporukpo, G. O. (eds) Ibadan Region , Department of Geography, University of Ibadan. pp72-84 Bagely, C., Jacobson, S. and Rehin, A. (1976). 'Completed Suicide. A Taxonomic Analysis of Clinical and Social Data', Psychological Medicine. Vol 6 pp. 429 - 438. Charron, M. (2012). Neighbourhood characteristics and the distribution of crime in Toronto: Additional analysis on youth crime. Crime and Justice Research Paper Series. Ottawa, ON: Statistics Canada. Faris, R.E.L. and Dunham, H.W (1939). Mental Disorders in Urban Areas. Chicago: University of Chicago Press. Gana, R. N. (1996). “A Comparative Analysis of Development Control Implementation in Minna and Bida, Niger State” (Unpublished Ph. D Dissertation) Department of Geography, University of Ilorin, Nigeria pp 87- 106. Herbert, D.T. and Johnston, R.J. (1978). Social Areas as Sampling Framework or Social Survey. Town Planning Review 45(1) pp171-188 Mabogunje, A.L (1968). Urbanization in Nigeria. London University Press. Melbourne Institute of Applied Economic and Social Research National Population Commission (1991). Population Census, Lagos. Federal Government Press National Population Commission (2010). Federal Republic of Nigeria 2006 Population and Housing Census, Abuja. Federal Government Press. Okewole, I. A. (1977). An Approach to Integration between the Tradition and Contemporary Areas of Ogbomoso. (Unpublished Master thesis), Department of Urban and Regional Planning Ahmadu Bello University, Zaria, Nigeria. Onokerhoraye, A.G. and Omuta, G.E.D. (1986). Residential Areas of the City. The Geography and Planning Series. University of Benin, Nigeria pp 651-657. Onibokun, A.G. (1972). Nigerian Cities. Their Rehabilitation and Residential Redevelopment Journal of Royal Town Planning Institute 58 (2) pp.5-56. Philip, J. C. (2008). Assessing Urban Crime and Its Control. An Overview. National Bureau of Economic Research (NBER) Working Paper No. 13781 and Terry Standaford Institute of Public Policy, Duke University, Durham NC 27708 Shaw, C. D. and McKay, H. (1942). (Revised 1969) Juvenile Deliquency and Urban Areas. Chicago.:University of Chicago Press.
  • 7. Research on Humanities and Social Sciences www.iiste.org ISSN 2222-1719 (Paper) ISSN 2222-2863 (Online) Vol.3, No.10, 2013 102 Wikipedia, the Free Encyclopedia (2013) Table 1: Selected Localities in Ibadan. S/N Local Government Areas No of Questionnaire administered Residential Zones Localities 1 Ibadan North 77 High Yemetu, Oke Aremo, Oje, Itu Taba 52 Medium Mokola and Total Garden, 25 Low New Bodija 2 Ibadan North east 71 High Ode Aje, Beyerunka and Ita Bale Labo 47 Medium Iwo Road and Orita Basorun 24 Low Agodi 3 Ibadan South east 83 High Elekuro, Odinjo and Idi Arere 55 Medium Orita-Challenge and part of Yejide 27 Low Part of Felele 4 Ibadan South west 67 High Foko, Gege, Bode and Popoyemoja 44 Medium Odo-Ona and Oke-Bola. 22 Low Oluyole Estate 5 Ibadan North west 38 High Agbeni/Agbaje, Idikan and Abebi 26 Medium Eleyele 13 Low Onireke GRA Total 671 Source: Author’s, 2010 Table 2: Categories of Crime S/N Crime Category Crime Types 1 Crime of acquisition Armed robbery, robbery, car snatching, theft and other stealing, house breaking, store/shop breaking, school breaking, forcible entry, burglary, gambling, demanding with menace, suspected stolen vehicle, procuration of minor gift, other property related offenses, foreign exchange, cyber crime. 2 Crime of stealth/pretence False pretence, mischief, cheating , unlawful possession, receiving stolen property, being in possession, 3 Crime of aggression Murder, attempted murder, manslaughter, kidnapping, child stealing, abduction, homicide, suicide, attempted suicide, slave dealing, threatening violence, and other offenses against persons, 4 Crime of assaults Grievous harm/wounding, assault occasioning harm, assault, intimidation, intentional insult, deformation of character 5 Crime against morality and custom Rape, attempt to commit rape, indecent assault, enticing, defilement 6 Crime against property Arsons, destruction of property, fire incidence 7 Crime of public disorderliness Breach of peace, affray, public unrest, riot, inciting disturbance, obstruction, trespass, conspiracy/breach of trust 8 White collar crime Perjury, coining offenses, forgery of currency notes, forgery, bribery, corruption, misappropriation, impersonation, examination/election malpractices 9 Crime against public law and regulations Escape from lawful custody, resisting arrest 10 Unnatural crime Unnatural offenses, occultic/witchcraft trial by ordeal, sudden & unnatural death Source: Author’s 2010.
  • 8. Research on Humanities and Social Sciences www.iiste.org ISSN 2222-1719 (Paper) ISSN 2222-2863 (Online) Vol.3, No.10, 2013 103 Table 3: Intra-city Variation in Average Residential Crime Experienced by Households Residential Area Number of crime experienced (RCM) Proportion of RCM (%) Number of Respondents (N) ARCE = RCM/N Intra-city Deviation = ARCE - * Low 767 13.2 111 6.9 -2 Medium 2066 35.5 224 9.2 0.3 High 2983 51.3 319 9.4 0.5 Total 5816 100 654 8.9* Source: Author’s, 2010 Note: figures with * is the city ARCE, that is average crime experienced by a household within six months Table 4: Crime Categories in Ibadan S/N Crime Category Residential Densities Low (%) Medium (%) High (%) Total (%) 1 Crime of acquisition 341 (44.5) 1383 (66.9) 1722 (57.7) 3446 (59.3) 2 Crime of stealth/pretence 64 (8.3) 112 (5.4) 38 (1.3) 214 (3.7) 3 Crime of aggression 34 (4.4) 31 (1.5) 21 (0.7) 86 (1.5) 4 Crime of assaults 77 (10.0) 99 (4.8) 74 (2.5) 250 (0.04) 5 Crime against morality and custom 28 (3.7) 39 (1.9) 48 (1.6) 115 (1.9) 6 Crime against property 20 (2.6) 17 (0.8) 22 (0.7) 59 (1.0) 7 Crime of public disorderliness 82 (10.7) 141 (6.8) 718 (24.1) 941 (16.2) 8 White collar crime 96 (12.5) 231 (11.2) 323 (10.8) 650 (21.8) 9 Crime against public law and order 10 (1.3) 9 (0.4) 9 (0.3) 28 (0.9) 10 Unnatural crime 15 (1.9) 4 (0.2) 8 (0.3) 27 (0.5) Total (RCM) 767 (13.2) 2066 (35.5) 2983 (51.3) 5816 Source: Author’s, 2010 Note that the proportion is in parenthesis Table 5: Fear of Crime Events in Ibadan Events associated with crime incidence FCEI for Residential Areas FCEI FCEI- *FCEI (FCEI- *FCEI)2 Low Medium High Loss of one's life 1.3 0.9 0.6 0.9 0.1 0.01 ‘killing of household member’ 1.4 0.9 0.6 0.9 0.1 0.01 Female member of household raped 1.2 0.8 0.5 0.8 0 0 Self raped 0.9 0.7 0.5 0.7 -0.1 0.01 Kidnapping 0.8 0.7 0.4 0.6 -0.2 0.04 Self tortured or beaten 1.3 1.1 0.6 1.0 0.2 0.04 Female household member tortured or beaten 1.1 0.9 0.5 0.8 0 0 Infection with HIV/AIDS/other STD 1.0 0.8 0.5 0.8 0 0 Shock or psychological imbalance 1.81 0.9 0.7 1.1 0.3 0.09 Property carted away 1.81 0.9 0.5 1.1 0.3 0.09 Money stolen 1.6 0.9 0.5 1.0 0.2 0.04 Destruction of window/door locks and or burglar proof 0.9 0.7 0.9 0.8 0 0 Vandalization of vehicle(s) 0.7 0.6 0.3 0.5 -0.3 0.09 Burning of houses and properties 0.5 0.5 0.3 0.4 -0.4 0.16 Burning of vehicle(s) 0.5 0.5 0.3 0.4 -0.4 0.16 Total 16.81 11.8 7.7 11.8 0.1 *FCEI 1.1 0.8 0.5 0.8 Source: Author’s, 2010
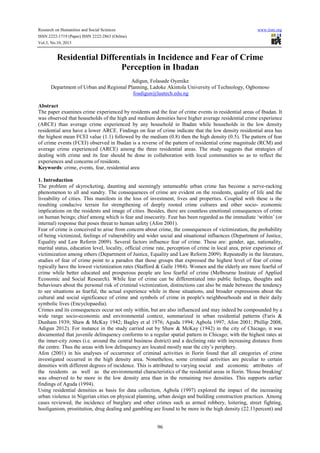
  • 9. Research on Humanities and Social Sciences ISSN 2222-1719 (Paper) ISSN 2222-2863 (Online) Vol.3, No.10, 2013 Figure 1:Study Area within the Context of Oyo State N Source: Macmillan Nigeria Secondary Atlas (2006 SAKI WEST ATISBO IWAJOWA IBARAPA NORTH REPUBLICOFBENIN O G U N S T A T E SCALE;1:1 622 222 Kilometres stealth/pretence, 3.7 aggression, 1.5 assaults, 0.04 against morality and custom, 1.9 against property, 1 Research on Humanities and Social Sciences 2863 (Online) 104 Figure 1:Study Area within the Context of Oyo State Source: Macmillan Nigeria Secondary Atlas (2006 ) STUDY AREA State Boundary SAKI WEST SAKI EAST ATISBO KAJOLA ITESIWAJU ATIBA ORELOPE OLORUNSOGO ORIIRE OYO EAST OYO WEST ISEYIN IBARAPA NORTH IBARAPA EAST IDO IBARAPA CENTRAL AKINYELE AFIJIO IREPO ONA-ARA LAGELU OLUYOLE EGBEDA OGBOMOSO SOUTH SURULERE OGO-OLUWA OGBOMOSO NORTH K W ARA STATE K W A R A S T A T E 12 3 4 5 IBADAN NORTH IBADAN NORTH-WEST IBADAN SOUTH-WEST IBADAN SOUTH-EAST IBADAN NORTH-EAST 1 2 3 4 5 Local Govt. Boundary International Boundary acquisition, 59.3 stealth/pretence, 3.7 aggression, 1.5 assaults, 0.04 public disorderliness, 16.2 White collar crime, 21.8 against public law and order, 0.9 Unnatural crime, 0.5 Figure 2 : Categories of Crime in Ibadan (%) www.iiste.org acquisition, 59.3 Unnatural crime, 0.5 Figure 2 : Categories of Crime in Ibadan (%)
  • 10. This academic article was published by The International Institute for Science, Technology and Education (IISTE). The IISTE is a pioneer in the Open Access Publishing service based in the U.S. and Europe. The aim of the institute is Accelerating Global Knowledge Sharing. More information about the publisher can be found in the IISTE’s homepage: http://www.iiste.org CALL FOR PAPERS The IISTE is currently hosting more than 30 peer-reviewed academic journals and collaborating with academic institutions around the world. There’s no deadline for submission. Prospective authors of IISTE journals can find the submission instruction on the following page: http://www.iiste.org/Journals/ The IISTE editorial team promises to the review and publish all the qualified submissions in a fast manner. All the journals articles are available online to the readers all over the world without financial, legal, or technical barriers other than those inseparable from gaining access to the internet itself. Printed version of the journals is also available upon request of readers and authors. IISTE Knowledge Sharing Partners EBSCO, Index Copernicus, Ulrich's Periodicals Directory, JournalTOCS, PKP Open Archives Harvester, Bielefeld Academic Search Engine, Elektronische Zeitschriftenbibliothek EZB, Open J-Gate, OCLC WorldCat, Universe Digtial Library , NewJour, Google Scholar