Assessing human activities and their effects on water quality the case of bulpeila dam in the tamale metropolis of northern region of ghana
•
1 gostou•354 visualizações

International journals call for papers, http://www.iiste.org/

Recomendados
Mais conteúdo relacionado
Mais procurados
Mais procurados (19)
Destaque
Destaque (17)
Semelhante a Assessing human activities and their effects on water quality the case of bulpeila dam in the tamale metropolis of northern region of ghana
Semelhante a Assessing human activities and their effects on water quality the case of bulpeila dam in the tamale metropolis of northern region of ghana (13)
Mais de Alexander Decker
Mais de Alexander Decker (20)
Último
Último (20)
Assessing human activities and their effects on water quality the case of bulpeila dam in the tamale metropolis of northern region of ghana
- 1. Journal of Environment and Earth Science ISSN 2224-3216 (Paper) ISSN 2225 Vol. 3, No.4, 2013 Assessing Human Activities The Case of Bulpeila Dam Shamsu University for Development Studies Development Studies, Wa Campus Abstract Water is an important commodity for human sustenance. Human body is made up of about 70% of water. This illustrates the important role water play. In to ten kilometers in search for water for domestic use. The quality of water is often compromise by the same user. The same people using the water are the same people polluting the water bodies. farming, fishing, swimming, and dumping of waste material are often done by the water bodies. This paper is therefore to examine the human activities and how it impacts on water quality. In conducting these study both primary and secondary data collection methods were employed. INTRODUCTION Human need about 60 litres of water a day to stay healthy. The earth’s supply of accessible freshwaters is especially at risk that one out of three people in the developing world do not have a The United Nations Environmental Programme (UNEP, 1999) estimated that, the present shortage of clean water of the world’s population will not have adequate access to clean water. Unlike resources such as coal, oil or wheat, there is no substitute for water. We have a crisis on our hand and we have to explore and develop new approaches to meet these challenges (Smol, 2002) According to the World Health Organisation, three out five people in the developing nations do not have ac to clean drinking water. Water covers approximately 75% of our world’s surface, representing a volume over one billion cube kilometers. However, only a small portion of this water is fresh and accessible (Attenborough, 1984). In addition to municipal uses, water provides us with many other services such as fisheries and other food resources, transportation, recreation and other societal needs (Postal and Carpenter, 1997) According to Smol, 2002, the present critical issues such as acidification, eutrophication, land losses. It is well known that agriculture is single largest user of freshwater resources, using a global average of 70% of all surface water supplies. However, agriculture is both cause and victim of pollution. It is a cause through it discharge of pollutants and sediments to surface and / ground water, through net loss or soil by agricultural practices, and through sali wastewater and polluted surface and groundwater which contaminate crops and transmit disease to consumers and farm workers (FAO, 1990a) Water is essential to life, yet the pollutio reached crisis proportions in many regions (Smol, 2002) Although agriculture contributes to a wide range of water quality problems anthropogenic erosion and sedimentation is a global is associated with agriculture. In Ghana, despite the government effort to provide potable water for a large number of people so that the country can achieve one of the objectives of the Millennium Development Goals (MDGs) of available to all by the year 2015, the water problem situation appears to be getting out of hand. People farm close to water bodies or encroached on them. A holistic manner is needed to address water quality problems. We should remember that as long as we fail to address the issue of protecting water bodies and sources, people, especially women and children, will continue to travel long diseases to look for water. This will affect productivity and eventually the economy. Water is natural resource whose availability is beyond human control. But the same time we can protect what Journal of Environment and Earth Science 3216 (Paper) ISSN 2225-0948 (Online) 32 Assessing Human Activities and Their Effects on Water Quality: f Bulpeila Dam in the Tamale Metropolis Region of Ghana Shamsu-Deen Ziblim. Zshamsu72@Gmail.Com Contact: 233244202759 or Development Studies, Department of Environment and Resource Studies, Development Studies, Wa Campus, Box 520, Wa. Upper West, Region, Ghana. Water is an important commodity for human sustenance. Human body is made up of about 70% of water. This illustrates the important role water play. In developing country including Ghana people travel between five to ten kilometers in search for water for domestic use. The quality of water is often compromise by the same user. The same people using the water are the same people polluting the water bodies. Human activities such as farming, fishing, swimming, and dumping of waste material are often done by the water bodies. This paper is therefore to examine the human activities and how it impacts on water quality. In conducting these study both secondary data collection methods were employed. Human need about 60 litres of water a day to stay healthy. The earth’s supply of accessible freshwaters is especially at risk that one out of three people in the developing world do not have access to safe drinking water. The United Nations Environmental Programme (UNEP, 1999) estimated that, the present shortage of clean water of the world’s population will not have adequate access to clean water. Unlike resources such as coal, oil or here is no substitute for water. We have a crisis on our hand and we have to explore and develop new approaches to meet these challenges (Smol, 2002) According to the World Health Organisation, three out five people in the developing nations do not have ac to clean drinking water. Water covers approximately 75% of our world’s surface, representing a volume over one billion cube kilometers. However, only a small portion of this water is fresh and accessible (Attenborough, 1984). uses, water provides us with many other services such as fisheries and other food resources, transportation, recreation and other societal needs (Postal and Carpenter, 1997) According to Smol, 2002, the present-day water quality problems from an international perspective, covering critical issues such as acidification, eutrophication, land-use changes and pollution by metals and biodiversity losses. It is well known that agriculture is single largest user of freshwater resources, using a global average of 0% of all surface water supplies. However, agriculture is both cause and victim of pollution. It is a cause through it discharge of pollutants and sediments to surface and / ground water, through net loss or soil by agricultural practices, and through salinization and water logging of irrigated land. It is a victim through use of wastewater and polluted surface and groundwater which contaminate crops and transmit disease to consumers Water is essential to life, yet the pollution of the lakes and rivers has become an international problem that has reached crisis proportions in many regions (Smol, 2002) Although agriculture contributes to a wide range of water quality problems anthropogenic erosion and sedimentation is a global issue that tends to be primarily In Ghana, despite the government effort to provide potable water for a large number of people so that the country can achieve one of the objectives of the Millennium Development Goals (MDGs) of available to all by the year 2015, the water problem situation appears to be getting out of hand. People farm close to water bodies or encroached on them. A holistic manner is needed to address water quality problems. We s long as we fail to address the issue of protecting water bodies and sources, people, especially women and children, will continue to travel long diseases to look for water. This will affect productivity and eventually the economy. ce whose availability is beyond human control. But the same time we can protect what www.iiste.org n Water Quality: he Tamale Metropolis of Northern , Faculty of Integrated Box 520, Wa. Upper West, Region, Ghana. Water is an important commodity for human sustenance. Human body is made up of about 70% of water. developing country including Ghana people travel between five to ten kilometers in search for water for domestic use. The quality of water is often compromise by the same user. Human activities such as farming, fishing, swimming, and dumping of waste material are often done by the water bodies. This paper is therefore to examine the human activities and how it impacts on water quality. In conducting these study both Human need about 60 litres of water a day to stay healthy. The earth’s supply of accessible freshwaters is ccess to safe drinking water. The United Nations Environmental Programme (UNEP, 1999) estimated that, the present shortage of clean water of the world’s population will not have adequate access to clean water. Unlike resources such as coal, oil or here is no substitute for water. We have a crisis on our hand and we have to explore and develop new According to the World Health Organisation, three out five people in the developing nations do not have access to clean drinking water. Water covers approximately 75% of our world’s surface, representing a volume over one billion cube kilometers. However, only a small portion of this water is fresh and accessible (Attenborough, 1984). uses, water provides us with many other services such as fisheries and other food nal perspective, covering use changes and pollution by metals and biodiversity losses. It is well known that agriculture is single largest user of freshwater resources, using a global average of 0% of all surface water supplies. However, agriculture is both cause and victim of pollution. It is a cause through it discharge of pollutants and sediments to surface and / ground water, through net loss or soil by nization and water logging of irrigated land. It is a victim through use of wastewater and polluted surface and groundwater which contaminate crops and transmit disease to consumers n of the lakes and rivers has become an international problem that has reached crisis proportions in many regions (Smol, 2002) Although agriculture contributes to a wide range of sue that tends to be primarily In Ghana, despite the government effort to provide potable water for a large number of people so that the country can achieve one of the objectives of the Millennium Development Goals (MDGs) of making water available to all by the year 2015, the water problem situation appears to be getting out of hand. People farm close to water bodies or encroached on them. A holistic manner is needed to address water quality problems. We s long as we fail to address the issue of protecting water bodies and sources, people, especially women and children, will continue to travel long diseases to look for water. This will affect ce whose availability is beyond human control. But the same time we can protect what
- 2. Journal of Environment and Earth Science ISSN 2224-3216 (Paper) ISSN 2225 Vol. 3, No.4, 2013 nature has endowed us with through the sustainable management of the resource. That is why it is necessary to expose those whose activities have become a threat to the ava necessities of life (Dialy Graphic Commentary, March 25, 2008) Data on water pollution in developing countries are limited; such data are most “aggregated” not distinguishing the relative proportion of “point” and “nonpoint” sources. Pesticides consumption has strongly increased in all developing countries (FAO, 1999a). According to various surveys in india and Africa, 20 nitrate levels greater than 50mgl and in some cases as high as s Pretty, 1998). Agriculture is a major cause of degradation of surface and groundwater resources through erosion and runoff, has caused to be concerned about that the global implications of water quality. It e symbiosis of land and water and, as FAO (1999a) makes quite clear, “appropriate steps must be taken to ensure that agricultural activities do not adversely affect water quality so that subsequent uses of water for different purposes are not impaired”. Laundry detergents are the second most important anthropogenic sources of inorganic nutrient pollution (Chiras, 1994). Polluted water is a major cause of disease, misery and death. According to World Health Organisation (WHO), as many as four (4) million children die every year as a result of diarrhea caused by water infection. Surface runoff and consequently non pathogens in surface water bodies. Improperly designed rural s contamination of groundwater. Agricultural pollution is both a direct and indirect cause of human health impacts. The WHO reports that nitrogen levels in groundwater have grown in many parts of the world as a resul “intensification of farming practices” (WHO, 1993). Reiff(1987), in his discussion of irrigated agriculture, notes that, water pollution is both a cause and effect in linkages between agriculture and human health. The Bulpeila dam has over the years communities, serving as very important source of fish, water for irrigation and domestic use such as drinking and washing. However, human activities in the dam catchments area which could be not yet addressed and documented. It is against this background that, Bulpeila was chosen to investigate into how anthropogenic activities have influenced the water quality. This paper tries to examine the current land use some water quality parameters. Land Use Activities and Their Effects on Water Land use is the purpose to which land is put by humans (for example protected areas, forestry for timber products, plantation, row- crop agriculture, pasture and human settlements). The quantity and quality of water on the land surface depends to a large degree on land usage and human actions within watersheds (Dannis et al, 1988). Vegetation and use patterns in wat conditions of the waters bodies they drain into. In developing countries, the most prominent uses of land include agriculture, timber harvest that is deforestation, urbanization and mining. All th watershed. They very often have severe effects on the hydrology as the following effects are recognized; • Increased surface runoff. • Higher peak flows follow storms (Omerik, 1976) • Water Pollution Water pollution is any physical, biological or chemical change in water quality that adversely affects living organisms or makes water unsuitable for desired uses. Pollution standards and regulations usually distinguish between point and nonpoint pollution sources (Cunningham and Siago, once known as “diffuse” source pollution, arises from a broad group of human activities for which the pollutions have no obvious point of entry into receiving watercourse. In contract, point source pollution represe activities where wastewater is routed directly into receiving water bodies by, for example, discharge pipe, where they can be easily measured and controlled. In poorer, non-industrialized nations, water pollution is predominantly caused by human pathogenic organisms from this waste, pesticides, and sediment from unsound farming and timbering practices (Chiras, 1994). According to Cunningham and Siago, 1990, factories, power plants, sewage treatment plants, underground coal mines, and oil wells are classified as point sources because they discharge pollution from Journal of Environment and Earth Science 3216 (Paper) ISSN 2225-0948 (Online) 33 nature has endowed us with through the sustainable management of the resource. That is why it is necessary to expose those whose activities have become a threat to the availability of water and access to one of the basic necessities of life (Dialy Graphic Commentary, March 25, 2008) Data on water pollution in developing countries are limited; such data are most “aggregated” not distinguishing nt” and “nonpoint” sources. Pesticides consumption has strongly increased in all developing countries (FAO, 1999a). According to various surveys in india and Africa, 20 l and in some cases as high as several hundred milligrams per litre (Convey and Pretty, 1998). Agriculture is a major cause of degradation of surface and groundwater resources through erosion and runoff, has caused to be concerned about that the global implications of water quality. It e symbiosis of land and water and, as FAO (1999a) makes quite clear, “appropriate steps must be taken to ensure that agricultural activities do not adversely affect water quality so that subsequent uses of water for different Laundry detergents are the second most important anthropogenic sources of inorganic nutrient pollution (Chiras, 1994). Polluted water is a major cause of disease, misery and death. According to World Health Organisation ) million children die every year as a result of diarrhea caused by water infection. Surface runoff and consequently non-profit source pollution contributes significantly to high level of pathogens in surface water bodies. Improperly designed rural sanitary facilities also contribute to the contamination of groundwater. Agricultural pollution is both a direct and indirect cause of human health impacts. The WHO reports that nitrogen levels in groundwater have grown in many parts of the world as a resul “intensification of farming practices” (WHO, 1993). Reiff(1987), in his discussion of irrigated agriculture, notes that, water pollution is both a cause and effect in linkages between agriculture and human health. The Bulpeila dam has over the years been instrumental in sustaining the livelihood of its surrounding communities, serving as very important source of fish, water for irrigation and domestic use such as drinking and washing. However, human activities in the dam catchments area which could be a threat to the water quality is not yet addressed and documented. It is against this background that, Bulpeila was chosen to investigate into how anthropogenic activities have influenced the water quality. This paper tries to examine the current land use activities in the catchment’s areas of the dam and to monitor Land Use Activities and Their Effects on Water Land use is the purpose to which land is put by humans (for example protected areas, forestry for timber crop agriculture, pasture and human settlements). The quantity and quality of water on the land surface depends to a large degree on land usage and human actions within watersheds (Dannis et al, 1988). Vegetation and use patterns in watershed are known to have many significant influences on the conditions of the waters bodies they drain into. In developing countries, the most prominent uses of land include agriculture, timber harvest that is deforestation, urbanization and mining. All these affect run watershed. They very often have severe effects on the hydrology as the following effects are recognized; Higher peak flows follow storms (Omerik, 1976) , biological or chemical change in water quality that adversely affects living organisms or makes water unsuitable for desired uses. Pollution standards and regulations usually distinguish between point and nonpoint pollution sources (Cunningham and Siago, 1990). Nonpoint source water pollution, once known as “diffuse” source pollution, arises from a broad group of human activities for which the pollutions have no obvious point of entry into receiving watercourse. In contract, point source pollution represe activities where wastewater is routed directly into receiving water bodies by, for example, discharge pipe, where they can be easily measured and controlled. industrialized nations, water pollution is predominantly caused by human pathogenic organisms from this waste, pesticides, and sediment from unsound farming and timbering practices (Chiras, 1994). According to Cunningham and Siago, 1990, factories, power plants, sewage treatment plants, , and oil wells are classified as point sources because they discharge pollution from www.iiste.org nature has endowed us with through the sustainable management of the resource. That is why it is necessary to ilability of water and access to one of the basic Data on water pollution in developing countries are limited; such data are most “aggregated” not distinguishing nt” and “nonpoint” sources. Pesticides consumption has strongly increased in all developing countries (FAO, 1999a). According to various surveys in india and Africa, 20-25% of wells contains everal hundred milligrams per litre (Convey and Pretty, 1998). Agriculture is a major cause of degradation of surface and groundwater resources through erosion and runoff, has caused to be concerned about that the global implications of water quality. It exists within a symbiosis of land and water and, as FAO (1999a) makes quite clear, “appropriate steps must be taken to ensure that agricultural activities do not adversely affect water quality so that subsequent uses of water for different Laundry detergents are the second most important anthropogenic sources of inorganic nutrient pollution (Chiras, 1994). Polluted water is a major cause of disease, misery and death. According to World Health Organisation ) million children die every year as a result of diarrhea caused by water-borne profit source pollution contributes significantly to high level of anitary facilities also contribute to the contamination of groundwater. Agricultural pollution is both a direct and indirect cause of human health impacts. The WHO reports that nitrogen levels in groundwater have grown in many parts of the world as a result of Reiff(1987), in his discussion of irrigated agriculture, notes that, water pollution is both a cause and effect in been instrumental in sustaining the livelihood of its surrounding communities, serving as very important source of fish, water for irrigation and domestic use such as drinking and a threat to the water quality is not yet addressed and documented. It is against this background that, Bulpeila was chosen to investigate into activities in the catchment’s areas of the dam and to monitor Land use is the purpose to which land is put by humans (for example protected areas, forestry for timber crop agriculture, pasture and human settlements). The quantity and quality of water on the land surface depends to a large degree on land usage and human actions within watersheds (Dannis et al, ershed are known to have many significant influences on the conditions of the waters bodies they drain into. In developing countries, the most prominent uses of land include ese affect run-off flows in watershed. They very often have severe effects on the hydrology as the following effects are recognized; , biological or chemical change in water quality that adversely affects living organisms or makes water unsuitable for desired uses. Pollution standards and regulations usually distinguish 1990). Nonpoint source water pollution, once known as “diffuse” source pollution, arises from a broad group of human activities for which the pollutions have no obvious point of entry into receiving watercourse. In contract, point source pollution represents those activities where wastewater is routed directly into receiving water bodies by, for example, discharge pipe, where industrialized nations, water pollution is predominantly caused by human and animal wastes, pathogenic organisms from this waste, pesticides, and sediment from unsound farming and timbering practices (Chiras, 1994). According to Cunningham and Siago, 1990, factories, power plants, sewage treatment plants, , and oil wells are classified as point sources because they discharge pollution from
- 3. Journal of Environment and Earth Science ISSN 2224-3216 (Paper) ISSN 2225 Vol. 3, No.4, 2013 specific locations such as frain pipes, ditches or sewers outfalls. These sources are discrete and identifiable, so they are relatively easy to monitor and regulate. Nonp having no specific location where they discharge into a particular body of water. Nonpoint sources include runoff from farm field and feedlots, golf courses, lawns and gardens, construction sites, streets, parking lots and so on. As Novotny and Olem (1994) point out, the terms point and nonpoint sources tend to have assumed legal rather than technical meanings. This is because in most countries. All types of agricultural practices and land use. Including animal feeding operations (feedlots) are treated as a nonpoint sources. Non-point sources respond to hydrological conditions, are not easily measured or controlled directly and focus on land and related management practices. Agriculture Impacts on Water Quality The agricultural practices have profound effects on the watershed which includes the degradation of water quality and modification of natural flow regimes. Thus, increase in erosion, turbidity, total dissolved solids, fluctuations in discharge and temperature. Agricultural lands show high imports of dissolved nutrients in the form of nitrates (NO3) and phosphates (PO4) as a result of fertilizer application and loss of forest cover according to Nielsen et al. (1978). Stream could lead to eutrophication and depletion of dissolved oxygen as excess organic matter decomposes. In analysis of wetlands, Novotny and Olem (1994) reported that “Agriculture is the most degradation.” Nitrate levels have grown in some countries to the point where more than 10% of the population is exposed to nitrate levels in drinking water that are above 10 mg/l guideline. Lawrence and Kumppnarachi (1986) reporte nitrate concentrations approaching 40 cultivated irrigated paddy fields. Reiff (1987), in his discussion of irrigated agriculture, notes that water pollution is both a cause and effect in link between agriculture and human health. The United States in one of the few countries that systematically produce national statistics on water quality impairment by point nonpoint sources. In its 1986 Report to Congress, the United States Environ of assessed river miles in the United States were impacted by non point sources. Again in its most recent study, the US-EPA identified agriculture as the leading cause of water quality impairment of river United States Sediment, nutrients and pesticides occupy the first four categories of pollutions and are significantly associated with agriculture (Jolankai, 1986) Organic Sources of Nutrients into Water Bodies Agriculture is the predominant non- to increased erosion, pesticides and fertilizer use, coupled with poor land management can pollute neighboring surface water and groundwater. Drilling and waste disposal for waste disposal, septic tank, and hazardous waste dumps and landfills for municipal garbage can contaminate groundwater (Chiras, 1994). Animal slurry (urine and faeces) and silage effluent are two increase turbidity, total dissolved solids, nitrates and phosphates levels into surface water bodies. If such wastes enter streams, rivers or lakes, serobic decomposers, such as bacteria and fungi, will begin wastes, rapidly consuming oxygen in the water to do so and producing ammonia in the process. Anaerobic decomposition will result in the release of hydrogen sulphide, which is responsible for the characteristic foul odour of organically polluted water (Byrne, 1997). In developing countries, human sewages and animal wastes often enter streams and lakes from villages and farms increasing turbidity, total dissolved solids, nitrates and phosphates levels in the water body. During the degradation of organic pollutants, bacteria consume oxygen dissolved in water. When oxygen levels become very low, non oxygen-requiring bacteria take over, breaking down what’s left. In the process, they produce the fouling-smelling, toxic gases methane and hydroge Inorganic Sources of Nutrients into Water Bodies Inorganic fertilizers from croplands are the major anthropogenic source of plant nutrients in freshwater. When highly soluble fertilizers are used in excess, as much as 25% may be which increase nitrates and phosphates levels. Laundry detergents are the second most important anthropogenic Journal of Environment and Earth Science 3216 (Paper) ISSN 2225-0948 (Online) 34 specific locations such as frain pipes, ditches or sewers outfalls. These sources are discrete and identifiable, so they are relatively easy to monitor and regulate. Nonpoint sources of water pollution are scattered or diffused’ having no specific location where they discharge into a particular body of water. Nonpoint sources include runoff from farm field and feedlots, golf courses, lawns and gardens, construction sites, streets, parking lots and so on. As Novotny and Olem (1994) point out, the terms point and nonpoint sources tend to have assumed legal rather than technical meanings. This is because in most countries. All types of ces and land use. Including animal feeding operations (feedlots) are treated as a nonpoint point sources respond to hydrological conditions, are not easily measured or controlled directly and focus on land and related management practices. riculture Impacts on Water Quality The agricultural practices have profound effects on the watershed which includes the degradation of water quality and modification of natural flow regimes. Thus, increase in erosion, turbidity, total dissolved solids, ctuations in discharge and temperature. Agricultural lands show high imports of dissolved nutrients in the form of nitrates (NO3) and phosphates (PO4) as a result of fertilizer application and loss of forest cover according to Nielsen et al. (1978). Streams, lakes, and reservoirs have increased primary productivity, which could lead to eutrophication and depletion of dissolved oxygen as excess organic matter decomposes. In analysis of wetlands, Novotny and Olem (1994) reported that “Agriculture is the most land use causing wetland Nitrate levels have grown in some countries to the point where more than 10% of the population is exposed to nitrate levels in drinking water that are above 10 mg/l guideline. Lawrence and Kumppnarachi (1986) reporte nitrate concentrations approaching 40 -45 mg N/l in irrigation wells that are located close to the intensively cultivated irrigated paddy fields. Reiff (1987), in his discussion of irrigated agriculture, notes that water pollution ect in link between agriculture and human health. The United States in one of the few countries that systematically produce national statistics on water quality impairment by point nonpoint sources. In its 1986 Report to Congress, the United States Environmental Protection Agency (US-EPA) reported that 65% of assessed river miles in the United States were impacted by non point sources. Again in its most recent study, EPA identified agriculture as the leading cause of water quality impairment of river United States Sediment, nutrients and pesticides occupy the first four categories of pollutions and are significantly associated with agriculture (Jolankai, 1986) Organic Sources of Nutrients into Water Bodies -point pollution source. This is because disruption of natural vegetation lead to increased erosion, pesticides and fertilizer use, coupled with poor land management can pollute neighboring surface water and groundwater. Drilling and waste disposal is another non-point pollution source. Injection wells for waste disposal, septic tank, and hazardous waste dumps and landfills for municipal garbage can contaminate Animal slurry (urine and faeces) and silage effluent are two major types of agriculture organic wastes which increase turbidity, total dissolved solids, nitrates and phosphates levels into surface water bodies. If such wastes enter streams, rivers or lakes, serobic decomposers, such as bacteria and fungi, will begin wastes, rapidly consuming oxygen in the water to do so and producing ammonia in the process. Anaerobic decomposition will result in the release of hydrogen sulphide, which is responsible for the characteristic foul olluted water (Byrne, 1997). In developing countries, human sewages and animal wastes often enter streams and lakes from villages and farms increasing turbidity, total dissolved solids, nitrates and phosphates levels in the water body. During the on of organic pollutants, bacteria consume oxygen dissolved in water. When oxygen levels become requiring bacteria take over, breaking down what’s left. In the process, they produce the smelling, toxic gases methane and hydrogen sulfide (Chiras, 1994). Inorganic Sources of Nutrients into Water Bodies Inorganic fertilizers from croplands are the major anthropogenic source of plant nutrients in freshwater. When highly soluble fertilizers are used in excess, as much as 25% may be washed into streams and lakes by the rain which increase nitrates and phosphates levels. Laundry detergents are the second most important anthropogenic www.iiste.org specific locations such as frain pipes, ditches or sewers outfalls. These sources are discrete and identifiable, so oint sources of water pollution are scattered or diffused’ having no specific location where they discharge into a particular body of water. Nonpoint sources include runoff from farm field and feedlots, golf courses, lawns and gardens, construction sites, logging areas, roads, streets, parking lots and so on. As Novotny and Olem (1994) point out, the terms point and nonpoint sources tend to have assumed legal rather than technical meanings. This is because in most countries. All types of ces and land use. Including animal feeding operations (feedlots) are treated as a nonpoint point sources respond to hydrological conditions, are not easily measured or controlled directly and The agricultural practices have profound effects on the watershed which includes the degradation of water quality and modification of natural flow regimes. Thus, increase in erosion, turbidity, total dissolved solids, ctuations in discharge and temperature. Agricultural lands show high imports of dissolved nutrients in the form of nitrates (NO3) and phosphates (PO4) as a result of fertilizer application and loss of forest cover s, lakes, and reservoirs have increased primary productivity, which could lead to eutrophication and depletion of dissolved oxygen as excess organic matter decomposes. In analysis land use causing wetland Nitrate levels have grown in some countries to the point where more than 10% of the population is exposed to nitrate levels in drinking water that are above 10 mg/l guideline. Lawrence and Kumppnarachi (1986) reported 45 mg N/l in irrigation wells that are located close to the intensively cultivated irrigated paddy fields. Reiff (1987), in his discussion of irrigated agriculture, notes that water pollution ect in link between agriculture and human health. The United States in one of the few countries that systematically produce national statistics on water quality impairment by point nonpoint sources. EPA) reported that 65% of assessed river miles in the United States were impacted by non point sources. Again in its most recent study, EPA identified agriculture as the leading cause of water quality impairment of rivers and lakes in the United States Sediment, nutrients and pesticides occupy the first four categories of pollutions and are point pollution source. This is because disruption of natural vegetation lead to increased erosion, pesticides and fertilizer use, coupled with poor land management can pollute neighboring point pollution source. Injection wells for waste disposal, septic tank, and hazardous waste dumps and landfills for municipal garbage can contaminate major types of agriculture organic wastes which increase turbidity, total dissolved solids, nitrates and phosphates levels into surface water bodies. If such wastes enter streams, rivers or lakes, serobic decomposers, such as bacteria and fungi, will begin to break down the wastes, rapidly consuming oxygen in the water to do so and producing ammonia in the process. Anaerobic decomposition will result in the release of hydrogen sulphide, which is responsible for the characteristic foul In developing countries, human sewages and animal wastes often enter streams and lakes from villages and farms increasing turbidity, total dissolved solids, nitrates and phosphates levels in the water body. During the on of organic pollutants, bacteria consume oxygen dissolved in water. When oxygen levels become requiring bacteria take over, breaking down what’s left. In the process, they produce the Inorganic fertilizers from croplands are the major anthropogenic source of plant nutrients in freshwater. When washed into streams and lakes by the rain which increase nitrates and phosphates levels. Laundry detergents are the second most important anthropogenic
- 4. Journal of Environment and Earth Science ISSN 2224-3216 (Paper) ISSN 2225 Vol. 3, No.4, 2013 source of inorganic nutrient pollution. Many detergents contain synthetic phosphates, called tripolyhosp (TPPs). The phosphates stimulate the growth of aquatic algae, causing sudden spurts growth called algal blooms (Chiras, 1994). Pollution by Sediments Sediment is a major problem in developing countries where poor farming practices, overgrazing, and logging practices occur. The deposition of sediment in lakes speeds up natural succession; result in a gradual widening of the channel. As streams fill, they become shallow. Water temperature may rise, lowering the amount of dissolved oxygen and making streams more vulnerable to organic pollutions that deplete oxygen (Chiras, 1994) Pollution by sediment has two major dimensions. One is the physical dimension degradation by gullying and sheet erosion and which leads both to waters, and to off-site ecological and physical impacts from deposition in river and lake beds. The other is a chemical dimension – the silt and clay fraction (<63 m fraction), is a primary Carrier of adsorbed ch especially phosphorus, chlorinated pesticides and most metals, which are transported by sediment into the aquatic system. Fertilizer as Water Pollutions and Eutrophication “Eutrophication” is the enrichment of surface waters with excess plant nut phosphate ions. While eutrophication occurs naturally, it is normally associated with anthropogenic source of nutrients (Byrne, 1997). The most complete global study of eutrophication was the organization for Econo Cooperative programme on Eutrophication carried out in the 1970s in eighteen countries (Janus and Vollenweider, 1981). According to Byrne 1997, accelerated eutrophication influenced by human activities occurred as a result of the following: • Increased use of phosphate • Increased use of nitrate fertilizers which has resulted in increased leaching from soil into freshwater. • Drainage or washings from intensive animal units • Bank erosion caused as a result of, for example, hedgerow remov Whereas nitrates are very soluble, phosphates are not, and so they usually enter the water as a result of erosion from land. Phosphorus is however, a common limiting factor in freshwater and it is usually the extra phosphorus which results in excess growth of plants so characteristic of the early stages of eutrophication. Eutrophication in lakes leads to the falling oxygen levels. The turbidity of the water increase, and detritus then sediments out on the bed of the lake. The “tropic status” of lakes is relationship between nutrients status of a lake and the growth of organic matter in the lake. Material and Methods The farming practices were identified by interviewing key informants and farmers questionnaire. Transect walk was also undertook throughout the catchments areas to observe the land use activities near the dam. The chemical data was collected from February, 2008 to June 2008; each time in the morning from 8:00am to 10:00am. The dam was stratified into three zones namely; downstream, midstream, and upstream starting from the landing site of the fishermen. Water samples were taken from these zones by sitting on the fishermen’s canoe through these points. Th voltaic bottle containers were used to fetch the water samples and were preserved for analysis in separate glass containers. A conductivity meter was used to measure conductivity. Dissolved oxygen a measured using a Crison OXI 45 oxymeter in probing in inserted inside the water at the depth of about 30cm. the dissolved oxygen and temperature values when stabilized were read and recorded. Turbidity was measured using a LaMotte 2020 turbid meter while a 64054V/V spectrophometer was used to measure the total dissolved solids. Journal of Environment and Earth Science 3216 (Paper) ISSN 2225-0948 (Online) 35 source of inorganic nutrient pollution. Many detergents contain synthetic phosphates, called tripolyhosp (TPPs). The phosphates stimulate the growth of aquatic algae, causing sudden spurts growth called algal blooms Sediment is a major problem in developing countries where poor farming practices, overgrazing, and logging practices occur. The deposition of sediment in lakes speeds up natural succession; result in a gradual widening of the channel. As streams fill, they become shallow. Water temperature may rise, lowering the amount aking streams more vulnerable to organic pollutions that deplete oxygen (Chiras, Pollution by sediment has two major dimensions. One is the physical dimension – Top soil loss and land degradation by gullying and sheet erosion and which leads both to excessive levels of turbidity in receiving site ecological and physical impacts from deposition in river and lake beds. The other is a the silt and clay fraction (<63 m fraction), is a primary Carrier of adsorbed ch especially phosphorus, chlorinated pesticides and most metals, which are transported by sediment into the Fertilizer as Water Pollutions and Eutrophication “Eutrophication” is the enrichment of surface waters with excess plant nutrients usually in the form of nitrate and phosphate ions. While eutrophication occurs naturally, it is normally associated with anthropogenic source of nutrients (Byrne, 1997). The most complete global study of eutrophication was the organization for Econo Cooperative programme on Eutrophication carried out in the 1970s in eighteen countries (Janus and Vollenweider, 1981). According to Byrne 1997, accelerated eutrophication influenced by human activities occurred as a result of the following: se of phosphate-containing detergents. Increased use of nitrate fertilizers which has resulted in increased leaching from soil into freshwater. Drainage or washings from intensive animal units Bank erosion caused as a result of, for example, hedgerow removal. Whereas nitrates are very soluble, phosphates are not, and so they usually enter the water as a result of erosion from land. Phosphorus is however, a common limiting factor in freshwater and it is usually the extra phosphorus owth of plants so characteristic of the early stages of eutrophication. Eutrophication in lakes leads to the falling oxygen levels. The turbidity of the water increase, and detritus then sediments out on the bed of the lake. The “tropic status” of lakes is the central concept of lake management which describes the relationship between nutrients status of a lake and the growth of organic matter in the lake. The farming practices were identified by interviewing key informants and farmers of the area using unstructured questionnaire. Transect walk was also undertook throughout the catchments areas to observe the land use activities near the dam. The chemical data was collected from February, 2008 to June 2008; each time in the m 8:00am to 10:00am. The dam was stratified into three zones namely; downstream, midstream, and upstream starting from the landing site of the fishermen. Water samples were taken from these zones by sitting on the fishermen’s canoe through these points. The water sample were taken at the depth 10 to 30cm. 500 ml voltaic bottle containers were used to fetch the water samples and were preserved for analysis in separate glass containers. A conductivity meter was used to measure conductivity. Dissolved oxygen a measured using a Crison OXI 45 oxymeter in probing in-situ because of their instability. This instrument was inserted inside the water at the depth of about 30cm. the dissolved oxygen and temperature values when recorded. Turbidity was measured using a LaMotte 2020 turbid meter while a 64054V/V spectrophometer was used to measure the total dissolved solids. www.iiste.org source of inorganic nutrient pollution. Many detergents contain synthetic phosphates, called tripolyhosphates (TPPs). The phosphates stimulate the growth of aquatic algae, causing sudden spurts growth called algal blooms Sediment is a major problem in developing countries where poor farming practices, overgrazing, and careless logging practices occur. The deposition of sediment in lakes speeds up natural succession; result in a gradual widening of the channel. As streams fill, they become shallow. Water temperature may rise, lowering the amount aking streams more vulnerable to organic pollutions that deplete oxygen (Chiras, Top soil loss and land excessive levels of turbidity in receiving site ecological and physical impacts from deposition in river and lake beds. The other is a the silt and clay fraction (<63 m fraction), is a primary Carrier of adsorbed chemicals, especially phosphorus, chlorinated pesticides and most metals, which are transported by sediment into the rients usually in the form of nitrate and phosphate ions. While eutrophication occurs naturally, it is normally associated with anthropogenic source of nutrients (Byrne, 1997). The most complete global study of eutrophication was the organization for Economic Cooperative programme on Eutrophication carried out in the 1970s in eighteen countries (Janus and Vollenweider, 1981). According to Byrne 1997, accelerated eutrophication influenced by human activities Increased use of nitrate fertilizers which has resulted in increased leaching from soil into freshwater. Whereas nitrates are very soluble, phosphates are not, and so they usually enter the water as a result of erosion from land. Phosphorus is however, a common limiting factor in freshwater and it is usually the extra phosphorus owth of plants so characteristic of the early stages of eutrophication. Eutrophication in lakes leads to the falling oxygen levels. The turbidity of the water increase, and detritus then sediments out on the central concept of lake management which describes the relationship between nutrients status of a lake and the growth of organic matter in the lake. of the area using unstructured questionnaire. Transect walk was also undertook throughout the catchments areas to observe the land use activities near the dam. The chemical data was collected from February, 2008 to June 2008; each time in the m 8:00am to 10:00am. The dam was stratified into three zones namely; downstream, midstream, and upstream starting from the landing site of the fishermen. Water samples were taken from these zones by sitting e water sample were taken at the depth 10 to 30cm. 500 ml voltaic bottle containers were used to fetch the water samples and were preserved for analysis in separate glass containers. A conductivity meter was used to measure conductivity. Dissolved oxygen and temperature were situ because of their instability. This instrument was inserted inside the water at the depth of about 30cm. the dissolved oxygen and temperature values when recorded. Turbidity was measured using a LaMotte 2020 turbid meter while a
- 5. Journal of Environment and Earth Science ISSN 2224-3216 (Paper) ISSN 2225 Vol. 3, No.4, 2013 Results and Discussing Table 1. Agriculture impacts on water quality February March PAR US MS DS Mean STD US DO (Mg/1) 9.4 8.9 9.0 4 9.11± 0.26 (9.37 -885) 6.8 TEM ( C)⁰ 19. 1 19. 4 19. 5 19.33±0.2 (19.53-19.13) 26. 9 NOᴣ(mg /1) 4.5 3.9 8 4.9 5 4.5±0.5(5.00-4. 00) 4.4 8 PO (m⁰ g/1) 2. 1 2 2.4 2.17±0.2(2.37-1 .97) 2.5 EC(ppm ) 0.7 6 0.9 8 0.7 7 0.84±0.12(0.96- 0.72) 0.8 6 TUR(N TU) 18 17. 0 18. 0 17.70±0.6(18.3 0-17.1) 26 TDS 76. 86 75. 65 74. 44 75.70±1.2(76.9 0-74.5) 97. 98 Key: DO: Dissolved Oxygen, TEM: Temperature, EC: Electrical Conductivity, TUR: Turbidity, TDS: Total Dissolved solid, US: Upstream, DS: Downstream, MS: Mid stream, STD: Standard deviation, PAR: Parameters From the table3, there is increase in Nitrates level in every month from February to April except from April to May which it remained the same as 5.63mg/l. The Phosphates l to May which it decreased from 4.25mgl to 3.2 mg/l The Electoral Conductivity levels also increased in every month from February to May but small incrase was realized from April to May which is 0.03ppm as co were 0.2 and 0.3 ppm respectively. Turbidity level on the hand increased in every month from February to May but increase rates were reduced. From February to March it increased by 8.3 NTU; March to A increased by 0.37 NTU. The same trend of changes were observed in the Total Dissolved Solids as it increased from February to March by 25.02 mg/l; March to April by 9.28mg/l and April to May by 2.3mg/l. The changes the parameters were attributed to the rainfall and the quantity of the water but not all the rainfalls resulted runoff. The changes in Dissolved Oxygen and Temperature have been represented by the graph that follows because they are related Journal of Environment and Earth Science 3216 (Paper) ISSN 2225-0948 (Online) 36 Table 1. Agriculture impacts on water quality March APRIL MS DS Mean STD U S MS DS Mean STD 6.10 6.5 6.5±0.35 (6.98-6.15) 4.6 4.1 4.3 4.33± 0.25 (4.58-4.08) 27 27. 5 27.13±0.3 (27.43-26.83) 34 34. 9 34.5 34.5± 0.45 (34.95-34.05) 4.5 4.9 8 4.7±0.3(5.00-4.40) 5.5 5.8 5.6 5.63±1.5(7.1-4.13 ) 2.8 2.6 8 2.7±0.15 (2.85-2.55) 6.2 3.4 6 3.08 4.25±2(6.25-2.25) 1.05 0.9 8 1±096(1.96-0.04) 1.1 5 1.0 6 1.05 1.09±0.6 (30.6-29.4) 27 25 26.00±1.4(27.4-24 .6) 31. 0 30. 0 30.3 3 30±0.6(30.6-29.4) 105. 65 98. 55 100.75±4.3(105.05 -96.45) 11 0 112 .4 110. 60 111±1.24(112.24- 109.76) DO: Dissolved Oxygen, TEM: Temperature, EC: Electrical Conductivity, TUR: Turbidity, TDS: Total Dissolved Upstream, DS: Downstream, MS: Mid stream, STD: Standard deviation, PAR: Parameters From the table3, there is increase in Nitrates level in every month from February to April except from April to May which it remained the same as 5.63mg/l. The Phosphates level also increase in every month from the April to May which it decreased from 4.25mgl to 3.2 mg/l The Electoral Conductivity levels also increased in every month from February to May but small incrase was realized from April to May which is 0.03ppm as compared to from February to March and March to May which Turbidity level on the hand increased in every month from February to May but increase rates were reduced. From February to March it increased by 8.3 NTU; March to April it increased by 4.33 NTU and April to May it increased by 0.37 NTU. The same trend of changes were observed in the Total Dissolved Solids as it increased from February to March by 25.02 mg/l; March to April by 9.28mg/l and April to The changes the parameters were attributed to the rainfall and the quantity of the water but The changes in Dissolved Oxygen and Temperature have been represented by the graph that follows because www.iiste.org MAY U S MS DS Mean STD 3.9 9 3.0 4 3.7 3.6±0.5 (4.1-3.1) 30. 9 31. 2 31. 6 31.23±0.35 (31.58-30.88) 5.6 5.7 5.6 5.63±0.1 (5.73-5.53) 3.3 3.1 3.0 8 3.2±0.12(3.32- 3.08) 1.1 5 1.0 6 1.0 5 1.1±0.02(1.12- 1.08) 31. 0 30. 0 31. 0 30.7±0.6(31.30 -30.1) 11 1 114 .2 111 .7 112.3±2(114.3- 110.3) DO: Dissolved Oxygen, TEM: Temperature, EC: Electrical Conductivity, TUR: Turbidity, TDS: Total Dissolved Upstream, DS: Downstream, MS: Mid stream, STD: Standard deviation, PAR: Parameters From the table3, there is increase in Nitrates level in every month from February to April except from April to evel also increase in every month from the April The Electoral Conductivity levels also increased in every month from February to May but small incrase was mpared to from February to March and March to May which Turbidity level on the hand increased in every month from February to May but increase rates were reduced. pril it increased by 4.33 NTU and April to May it increased by 0.37 NTU. The same trend of changes were observed in the Total Dissolved Solids as it increased The changes the parameters were attributed to the rainfall and the quantity of the water but The changes in Dissolved Oxygen and Temperature have been represented by the graph that follows because
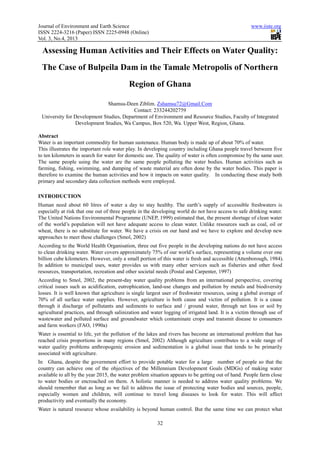
- 6. Journal of Environment and Earth Science ISSN 2224-3216 (Paper) ISSN 2225 Vol. 3, No.4, 2013 FIG: 2 A graph showing monthly average temperature and dissolved oxygen of Bulpeila in 2008 From the Graph, as the Temperature increases, dissolved oxygen decreases Results of the analysis indicate the anthropogenic activities in the catchments areas of Bulp multiple land use practices have led to the conveyance of excess nutrients loads into the dam through erosion and runoff. These land use practices have influenced the water quality because according to Dannis et al..,(1988), the quantity and quality of water depends to a large degree on land usage and human activities within the watershed. The clearing of land for human settlement and farming has rendered the site more prunes to soil erosion by rain or wind to discharge organic and inorganic prominent uses of land including agriculture, timber harvest or deforestation, urbanization and mining affect runoff flows in watersheds and this supports what was said by Omerik, (1976) Runoff from nonpoint sources pollutants such as feedlots or animal corals and waste products from human settlement and construction sites have entered the water body to increase the turbidity, total dissolved soils, nitrates and phosphates levels as Chiras (1994) point Human and animal wastes such as urine and faeces as these are sources of nutrients that wash into water bodies. Organic and inorganic fertilizer such as manure, NPK, 15 dieldrin) from the farms in the catchments areas that washed into the dam have increased nitrates and phosphates levels of the water as Nielsen et al.., (1978) reported that “Agricultural lands show high import of dissolved nutrients in the form of nitrates and phosphates as a result of fertilizer application and loss of forest cover”. Feaces and urine from the grazing animals; human waste from their defecations in the catchment areas and the refuse dumped at the place close to the dam hav phosphates level. The effluents of the laundry detergents from the washing of clothes and vehicle in the catchments areas contain synthetic phosphates, called tripolyphosphates (TTPs) whic level in the dam and this confirms that of Chiras(1994). A phosphate is however, a common limiting factor in freshwater (dam) and extra phosphates results in excess growth of plants so characteristic of eutrophication. Eutrophication in lake/dam leads to the falling of oxygen level. The turbity of the water increase, and detritus then sediments out on the bed of the lake/dam according to Janus and Vollenweader (1981). Increased use of phosphate containing detergent; increased use of nitrate fertilizers which has resulted in increased leaching from the soil into the dam; drainage or washing from intensive feedlots/animal corals and bank erosion have led to eutrophication. This is becaus influenced by the human activities occurred as a result these use practices. Also sediment from poor farming practices, overgrazing and careless trees cutting has led to the deposition of these sediment in the dam resulting in a gradual widening of the channel and according to Chiras(1994) as streams fill, they become shallow. Water temperature may rise lowering the amount of dissolved oxygen and making the water more vulnerable to organic pollutants th 0 5 10 15 20 25 30 35 FEBURARY, 2008 MARCH, 2008 Journal of Environment and Earth Science 3216 (Paper) ISSN 2225-0948 (Online) 37 G: 2 A graph showing monthly average temperature and dissolved oxygen of Bulpeila in 2008 From the Graph, as the Temperature increases, dissolved oxygen decreases Results of the analysis indicate the anthropogenic activities in the catchments areas of Bulp multiple land use practices have led to the conveyance of excess nutrients loads into the dam through erosion and runoff. These land use practices have influenced the water quality because according to Dannis et al..,(1988), the quality of water depends to a large degree on land usage and human activities within the watershed. The clearing of land for human settlement and farming has rendered the site more prunes to soil erosion by rain or wind to discharge organic and inorganic nutrients into the dam. This is because vegetation and prominent uses of land including agriculture, timber harvest or deforestation, urbanization and mining affect runoff flows in watersheds and this supports what was said by Omerik, (1976) onpoint sources pollutants such as feedlots or animal corals and waste products from human settlement and construction sites have entered the water body to increase the turbidity, total dissolved soils, nitrates and phosphates levels as Chiras (1994) points out that water pollution is predominately caused by Human and animal wastes such as urine and faeces as these are sources of nutrients that wash into water bodies. Organic and inorganic fertilizer such as manure, NPK, 15-15-15, ammonia as well as pestic dieldrin) from the farms in the catchments areas that washed into the dam have increased nitrates and phosphates levels of the water as Nielsen et al.., (1978) reported that “Agricultural lands show high import of dissolved he form of nitrates and phosphates as a result of fertilizer application and loss of forest cover”. Feaces and urine from the grazing animals; human waste from their defecations in the catchment areas and the refuse dumped at the place close to the dam have also increased its turbity, total dissolved solids’, nitrates and The effluents of the laundry detergents from the washing of clothes and vehicle in the catchments areas contain synthetic phosphates, called tripolyphosphates (TTPs) which as a result of erosion has increased the phosphates level in the dam and this confirms that of Chiras(1994). A phosphate is however, a common limiting factor in freshwater (dam) and extra phosphates results in excess growth of plants so characteristic of eutrophication. Eutrophication in lake/dam leads to the falling of oxygen level. The turbity of the water increase, and detritus then sediments out on the bed of the lake/dam according to Janus and Vollenweader (1981). phosphate containing detergent; increased use of nitrate fertilizers which has resulted in increased leaching from the soil into the dam; drainage or washing from intensive feedlots/animal corals and bank erosion have led to eutrophication. This is because; according to Byrne (1997) accelerated europhication influenced by the human activities occurred as a result these use practices. Also sediment from poor farming practices, overgrazing and careless trees cutting has led to the deposition of t in the dam resulting in a gradual widening of the channel and according to Chiras(1994) as streams fill, they become shallow. Water temperature may rise lowering the amount of dissolved oxygen and making the water more vulnerable to organic pollutants that deplete oxygen. This is why a rise of temperature MARCH, 2008 APRIL,2008 MAY, 2008 www.iiste.org G: 2 A graph showing monthly average temperature and dissolved oxygen of Bulpeila in 2008 Results of the analysis indicate the anthropogenic activities in the catchments areas of Bulpiela dam. The multiple land use practices have led to the conveyance of excess nutrients loads into the dam through erosion and runoff. These land use practices have influenced the water quality because according to Dannis et al..,(1988), the quality of water depends to a large degree on land usage and human activities within the watershed. The clearing of land for human settlement and farming has rendered the site more prunes to soil nutrients into the dam. This is because vegetation and prominent uses of land including agriculture, timber harvest or deforestation, urbanization and mining affect onpoint sources pollutants such as feedlots or animal corals and waste products from human settlement and construction sites have entered the water body to increase the turbidity, total dissolved soils, s out that water pollution is predominately caused by Human and animal wastes such as urine and faeces as these are sources of nutrients that wash into water bodies. 15, ammonia as well as pesticides (roundup and dieldrin) from the farms in the catchments areas that washed into the dam have increased nitrates and phosphates levels of the water as Nielsen et al.., (1978) reported that “Agricultural lands show high import of dissolved he form of nitrates and phosphates as a result of fertilizer application and loss of forest cover”. Feaces and urine from the grazing animals; human waste from their defecations in the catchment areas and the e also increased its turbity, total dissolved solids’, nitrates and The effluents of the laundry detergents from the washing of clothes and vehicle in the catchments areas contain h as a result of erosion has increased the phosphates level in the dam and this confirms that of Chiras(1994). A phosphate is however, a common limiting factor in freshwater (dam) and extra phosphates results in excess growth of plants so characteristic of the early stages of eutrophication. Eutrophication in lake/dam leads to the falling of oxygen level. The turbity of the water increase, and detritus then sediments out on the bed of the lake/dam according to Janus and Vollenweader (1981). phosphate containing detergent; increased use of nitrate fertilizers which has resulted in increased leaching from the soil into the dam; drainage or washing from intensive feedlots/animal corals and e; according to Byrne (1997) accelerated europhication Also sediment from poor farming practices, overgrazing and careless trees cutting has led to the deposition of t in the dam resulting in a gradual widening of the channel and according to Chiras(1994) as streams fill, they become shallow. Water temperature may rise lowering the amount of dissolved oxygen and at deplete oxygen. This is why a rise of temperature TEMP DO
- 7. Journal of Environment and Earth Science ISSN 2224-3216 (Paper) ISSN 2225 Vol. 3, No.4, 2013 resulted in decrease in dissolved oxygen level. The results indicate that as the turbity and total dissolved solids level increase, the electrical conductivity of the dam also increased. This because acc conduct an electrical current depends on the presence ion, their total concentration, mobility, valiancy and relative concentration and on temperature of the measurement. Solutions of relatively good conductors of electricity. Results of the analysis also show that the concentration of nitrates, phosphates, conductivity, turbidity and total dissolved soils range from February to May. The average values of ni Phosphates were 2.17, 2.7, 4.25 and 3.2mg/l; turbidity were 17.70, 26.0, 30 and 30.7 NTU; total dissolved solids were 75.7, 100.75, 111.0 and 112.3mg/l; electrical conductivity were 0.84, 1.0, 1.09 and 1.1 ppm; temper were 19.33, 27.13, 34.5 and 31.23⁰C whilst dissolved oxygen average values were 9.11, 6.5, 4.33 and 3.6mg/l in February, March, April and May respectively. The phosphates average values from February to May were above the recommended standard of WHO which is the 0.3mg/l and hence not suitable for drinking. Also it is above the EIFAC (1994) Standard for fisheries which is the range between 0.01 and 0.03mg/l. phosphorous (phosphates) are considered essential nutrients. However excessive phosphates levels lead to algal bloom (FAO, 2006). The Electrical Conductivity levels from February to May were above 0.7 ppm which is the WHO guideline for drinking. Therefore it is not satisfactory for drinking. It can however be used for irrigation according to the FAO (1985), because it is less than >3.0pp The water was highly turbid from February to May and not preferable for drinking as they were above the WHO standard which is 5.0 NTU. With respect to irrigation, the turbidity levels were also above FAO (1985) standards that is >5.0 NTU and hence not preferable for irrigation The total dissolved solids level in February was below 100mg/l which is the WHO standards for drinking but from April to May they were above No Effect Range as used by Ghana Water Commission. This makes it uns for drinking. For the irrigation, it can be used as it is within the range of no effect range according to the FAO (1985) Standard which is <450mg/l Conclusion and Recommendations The research and the results obtained indicate that the land use practi areas of the Bulpeila dam are directly and indirectly influencing the water quality of the dam. The human activities such as clear cutting of trees, urbanization and overgrazing of livestock have made the catchment areas prune to erosion and runoff and this agrees with the findings of Dannis et al.,(1988) and Omerik, (1976). The land use activities such as free range defecation by human beings, free range system of rearing livestock, crops cultivations and the associated use of fertilizers and pesticides; refuge dumping, washing of clothes and vehicles as well as wastes effluents are directly affecting the water quality as the runoff of the excess organic and inorganic nutrients into the water are polluting it. This and Nielsen et al.,(1978) The research conducted reveals the average values of water quality parameters of Bulpeila dam in the month February, March, April and May. The average values of Nitates are whilst those of phosphates are 2.17, 2.7, 4.25 and 3.2mg/l; turbidity average values are 17.70, 26, 30 and 30.7 NTU whilst total dissolved soils are 75.7, 100.75, 111.0 and 112.3 mg/l; electrical conductivity averag are 0.84, 1.0, 1.09 and 1.1 ppm whilst temperature are 19.33, 27.13, 34.5 and 31.23 average values are 9.1, 6.5, 4.33 and 3.6 in the month February, March, April and May respectively. The decrease in average values of dissol of temperature from 19.33⁰C to 34.5 fouling and atrophic conditions. The increase in average values of the oth Conductivity (from 0.84 to 1.10ppm), turbidity (from 17.7 to 30.7 NTU) and total dissolved solids (From 75.7 to 112.3mg/l) also indicates that the discharge of wastes from human activities has influenced the quality of the dam. Also, the average nitrates values from 4.5 to 5.63 mg/l and phosphates levels from 2.17 to 4.25mg/l show that there has been import of nutrients into the dam through the land use practices in the catchments areas. There is therefore the need for interventions. However, the following are recommended to put the situation under control; • Education; the people of Bulpeila and its surroundings must be educated to ensure proper sanitation practices in the catchment areas of the dam. They should be made awar solids and liquid wastes when washed into the dam will pollute it. There should be education on the medication of farming practices. Farming should be done at least 100 m away from the dam and Integrated Pest Management must be Journal of Environment and Earth Science 3216 (Paper) ISSN 2225-0948 (Online) 38 resulted in decrease in dissolved oxygen level. The results indicate that as the turbity and total dissolved solids level increase, the electrical conductivity of the dam also increased. This because according to APHA et al..,(19980, the ability of aqueous solution(water) to conduct an electrical current depends on the presence ion, their total concentration, mobility, valiancy and relative concentration and on temperature of the measurement. Solutions of most organic compounds are relatively good conductors of electricity. Results of the analysis also show that the concentration of nitrates, phosphates, conductivity, turbidity and total dissolved soils range from February to May. The average values of nitrates were 4.5,4.7.5.63 and 5.63mg/l; Phosphates were 2.17, 2.7, 4.25 and 3.2mg/l; turbidity were 17.70, 26.0, 30 and 30.7 NTU; total dissolved solids were 75.7, 100.75, 111.0 and 112.3mg/l; electrical conductivity were 0.84, 1.0, 1.09 and 1.1 ppm; temper C whilst dissolved oxygen average values were 9.11, 6.5, 4.33 and 3.6mg/l in February, March, April and May respectively. The phosphates average values from February to May were above the recommended standard of WHO which is able for drinking. Also it is above the EIFAC (1994) Standard for fisheries which is the range between 0.01 and 0.03mg/l. phosphorous (phosphates) are considered essential nutrients. However excessive phosphates levels lead to algal bloom (FAO, 2006). Electrical Conductivity levels from February to May were above 0.7 ppm which is the WHO guideline for drinking. Therefore it is not satisfactory for drinking. It can however be used for irrigation according to the FAO (1985), because it is less than >3.0ppm which is the standard. The water was highly turbid from February to May and not preferable for drinking as they were above the WHO standard which is 5.0 NTU. With respect to irrigation, the turbidity levels were also above FAO (1985) standards .0 NTU and hence not preferable for irrigation The total dissolved solids level in February was below 100mg/l which is the WHO standards for drinking but from April to May they were above No Effect Range as used by Ghana Water Commission. This makes it uns for drinking. For the irrigation, it can be used as it is within the range of no effect range according to the FAO Conclusion and Recommendations The research and the results obtained indicate that the land use practices and poor sanitation in the catchments areas of the Bulpeila dam are directly and indirectly influencing the water quality of the dam. The human activities such as clear cutting of trees, urbanization and overgrazing of livestock have made the catchment areas prune to erosion and runoff and this agrees with the findings of Dannis et al.,(1988) and Omerik, (1976). The land use activities such as free range defecation by human beings, free range system of rearing livestock, ciated use of fertilizers and pesticides; refuge dumping, washing of clothes and vehicles as well as wastes effluents are directly affecting the water quality as the runoff of the excess organic and inorganic nutrients into the water are polluting it. This supports what was said by Chiras, (1994); Byrne, (1997) The research conducted reveals the average values of water quality parameters of Bulpeila dam in the month February, March, April and May. The average values of Nitates are 4.5, 4.7, 5.63 and 5.63mg/l respectively whilst those of phosphates are 2.17, 2.7, 4.25 and 3.2mg/l; turbidity average values are 17.70, 26, 30 and 30.7 NTU whilst total dissolved soils are 75.7, 100.75, 111.0 and 112.3 mg/l; electrical conductivity averag are 0.84, 1.0, 1.09 and 1.1 ppm whilst temperature are 19.33, 27.13, 34.5 and 31.23⁰C. The dissolve oxygen average values are 9.1, 6.5, 4.33 and 3.6 in the month February, March, April and May respectively. The decrease in average values of dissolved oxygen from 9.11 mg/l to 3.6mg/l and the increase of average values C to 34.5⁰C from the results shown in table 3 are the indication that the dam is in fouling and atrophic conditions. The increase in average values of the other parameters such as Electrical Conductivity (from 0.84 to 1.10ppm), turbidity (from 17.7 to 30.7 NTU) and total dissolved solids (From 75.7 to 112.3mg/l) also indicates that the discharge of wastes from human activities has influenced the quality of the dam. Also, the average nitrates values from 4.5 to 5.63 mg/l and phosphates levels from 2.17 to 4.25mg/l show that there has been import of nutrients into the dam through the land use practices in the catchments areas. erventions. However, the following are recommended to put the situation under control; Education; the people of Bulpeila and its surroundings must be educated to ensure proper sanitation practices in the catchment areas of the dam. They should be made aware that improper disposal of solids and liquid wastes when washed into the dam will pollute it. There should be education on the medication of farming practices. Farming should be done at least 100 m away from the dam and Integrated Pest Management must be taught and promoted. The people should also be educated to www.iiste.org The results indicate that as the turbity and total dissolved solids level increase, the electrical conductivity of the ording to APHA et al..,(19980, the ability of aqueous solution(water) to conduct an electrical current depends on the presence ion, their total concentration, mobility, valiancy and most organic compounds are Results of the analysis also show that the concentration of nitrates, phosphates, conductivity, turbidity and total trates were 4.5,4.7.5.63 and 5.63mg/l; Phosphates were 2.17, 2.7, 4.25 and 3.2mg/l; turbidity were 17.70, 26.0, 30 and 30.7 NTU; total dissolved solids were 75.7, 100.75, 111.0 and 112.3mg/l; electrical conductivity were 0.84, 1.0, 1.09 and 1.1 ppm; temperature C whilst dissolved oxygen average values were 9.11, 6.5, 4.33 and 3.6mg/l in The phosphates average values from February to May were above the recommended standard of WHO which is able for drinking. Also it is above the EIFAC (1994) Standard for fisheries which is the range between 0.01 and 0.03mg/l. phosphorous (phosphates) are considered essential nutrients. However Electrical Conductivity levels from February to May were above 0.7 ppm which is the WHO guideline for drinking. Therefore it is not satisfactory for drinking. It can however be used for irrigation according to the FAO The water was highly turbid from February to May and not preferable for drinking as they were above the WHO standard which is 5.0 NTU. With respect to irrigation, the turbidity levels were also above FAO (1985) standards The total dissolved solids level in February was below 100mg/l which is the WHO standards for drinking but from April to May they were above No Effect Range as used by Ghana Water Commission. This makes it unsafe for drinking. For the irrigation, it can be used as it is within the range of no effect range according to the FAO ces and poor sanitation in the catchments areas of the Bulpeila dam are directly and indirectly influencing the water quality of the dam. The human activities such as clear cutting of trees, urbanization and overgrazing of livestock have made the catchments areas prune to erosion and runoff and this agrees with the findings of Dannis et al.,(1988) and Omerik, (1976). The land use activities such as free range defecation by human beings, free range system of rearing livestock, ciated use of fertilizers and pesticides; refuge dumping, washing of clothes and vehicles as well as wastes effluents are directly affecting the water quality as the runoff of the excess organic and supports what was said by Chiras, (1994); Byrne, (1997) The research conducted reveals the average values of water quality parameters of Bulpeila dam in the month 4.5, 4.7, 5.63 and 5.63mg/l respectively whilst those of phosphates are 2.17, 2.7, 4.25 and 3.2mg/l; turbidity average values are 17.70, 26, 30 and 30.7 NTU whilst total dissolved soils are 75.7, 100.75, 111.0 and 112.3 mg/l; electrical conductivity average values C. The dissolve oxygen average values are 9.1, 6.5, 4.33 and 3.6 in the month February, March, April and May respectively. ved oxygen from 9.11 mg/l to 3.6mg/l and the increase of average values C from the results shown in table 3 are the indication that the dam is in er parameters such as Electrical Conductivity (from 0.84 to 1.10ppm), turbidity (from 17.7 to 30.7 NTU) and total dissolved solids (From 75.7 to 112.3mg/l) also indicates that the discharge of wastes from human activities has influenced the quality of the dam. Also, the average nitrates values from 4.5 to 5.63 mg/l and phosphates levels from 2.17 to 4.25mg/l show that there has been import of nutrients into the dam through the land use practices in the catchments areas. Education; the people of Bulpeila and its surroundings must be educated to ensure proper sanitation e that improper disposal of solids and liquid wastes when washed into the dam will pollute it. There should be education on the medication of farming practices. Farming should be done at least 100 m away from the dam and taught and promoted. The people should also be educated to
- 8. Journal of Environment and Earth Science ISSN 2224-3216 (Paper) ISSN 2225 Vol. 3, No.4, 2013 regulate the use of the fertilizers. An alternative system of keeping animals such as intensive system should be encouraged. • Enactment of bye-laws by the Tamale Metropolitan Assembly to barn free houses and dumping refuges, washing of clothes and vehicles at a distance close to the dam. • There should be regular monitoring of plans and developments of the catchments areas of the dam to check activities that can affect the • There should also be continuous monitoring of the water quality of the dam. REFERENCES 1. APHA (1998). “Standard Methods for Examination of Water and Wastewater.” 20 2. Appelgre, BG (1994). Agricultural and Envirome TCP/LIT/2352, Technical Cooperation Programme, FAO, Rome 3. Attenborough, DN(1984). The living Planet Collins, British Broadcasting Coorporation, London 4. Bonel M and L.A Bruijnzeel, (2005). Forest, Water Hydrological Research for Integrated Land and Water Management, Cambridge University Press, 814-832pp 5. Byrne K. (1997). Bath Advance Science. Enviromental Science. Second Edition, Nelson Thomas Delta Place, 27 Bath Road, Cheltenham, GL 53 7 6. Chiras D.D. (1994) Enivromental Science, Action for a Sustainable Future. 4 7. Cunningham and Siago(1990). Enviromental Science, A Global Concern Wm. C, Dubuque, / a Bogota Boston Buenos Aires Carcas Chicago Guiford, CT Lodon, 421 8. Daily Graphic Commentary (Tuesday, March 25, 2008) World Water Day, Protecting Water Sources, Issue of Poor Sanitation and its Effect on Water Quality, 7p. 9. Dennis, LL, Dils, R.E Gray J. (1988) 10. ECAPH (1992). Water quality, analysis and management. Book Aid International, the Open University, Walton Hall. Milton Keynes, MK7 6AA, UNIT 5 11. Ecu (1982). Protection of Inland Waters aga Paper # ECE/ENVW A/26, Geneva 12. European Inland Fisheries Advisory Commission (EIFAC), (1964). Water Quality Criteria for European Freshwater Fish Report and Agricultural Organisation of United Natio 13. Extence, CA. (1978). The effects of motorway construction on the urban stream Environmental Pollution 17: 245-252 14. FAO. (1984). Enivromental Management for Vector control in rice fields. T.H. Mather. Irrigation and Drainage Paper 41, FAO, Rome. 152p 15. FAO.(1985). Water quality for Agriculture. Ayers, R.S and Westcott, D.W. FAO Irrigation and Drainage Paper No. 29, Rev 1. FAO, Rome. 174pp. 16. FAO. (1990a). Water and sustainable Agricultural Development: A strategy for the implementation of Mar del Plata Action Plan for the 1990s. FAO, Rome. 17. FAO. (1994b). Agricultural and Enviromenatl Legislation FAO-LED: TCPP/LIT/2352, Technical Cooperation Programme, FAO, Rome 18. FAO. (2006). Control of Pollutio Journal of Environment and Earth Science 3216 (Paper) ISSN 2225-0948 (Online) 39 regulate the use of the fertilizers. An alternative system of keeping animals such as intensive system laws by the Tamale Metropolitan Assembly to barn free range defecation, building houses and dumping refuges, washing of clothes and vehicles at a distance close to the dam. There should be regular monitoring of plans and developments of the catchments areas of the dam to check activities that can affect the quality of the water There should also be continuous monitoring of the water quality of the dam. APHA (1998). “Standard Methods for Examination of Water and Wastewater.” 20th edition. Washington DC Appelgre, BG (1994). Agricultural and Enviromental Legislation-Lithuania, Technical Report . FAO TCP/LIT/2352, Technical Cooperation Programme, FAO, Rome Attenborough, DN(1984). The living Planet Collins, British Broadcasting Coorporation, London Bonel M and L.A Bruijnzeel, (2005). Forest, Water and People in Humid Tropics, Past, Present and Future Hydrological Research for Integrated Land and Water Management, Cambridge University Press, Byrne K. (1997). Bath Advance Science. Enviromental Science. Second Edition, Nelson Thomas Delta ce, 27 Bath Road, Cheltenham, GL 53 7TH United Kingdom 235-363pp Chiras D.D. (1994) Enivromental Science, Action for a Sustainable Future. 4th Edition, 405 Cunningham and Siago(1990). Enviromental Science, A Global Concern Wm. C, Dubuque, / a Bogota Boston Buenos Aires Carcas Chicago Guiford, CT Lodon, 421-435pp Daily Graphic Commentary (Tuesday, March 25, 2008) World Water Day, Protecting Water Sources, Issue of Poor Sanitation and its Effect on Water Quality, 7p. Dennis, LL, Dils, R.E Gray J. (1988). Renewable Natural Resources. Westview press. Inc. New York, 316pp ECAPH (1992). Water quality, analysis and management. Book Aid International, the Open University, Walton Hall. Milton Keynes, MK7 6AA, UNIT 5-6 Ecu (1982). Protection of Inland Waters against Eutrophication. United Nations Commission for Europe, Paper # ECE/ENVW A/26, Geneva European Inland Fisheries Advisory Commission (EIFAC), (1964). Water Quality Criteria for European Freshwater Fish Report and Agricultural Organisation of United Nations, Rome, EIFACI. 21pp Extence, CA. (1978). The effects of motorway construction on the urban stream Environmental Pollution 17: FAO. (1984). Enivromental Management for Vector control in rice fields. T.H. Mather. Irrigation and FAO, Rome. 152p FAO.(1985). Water quality for Agriculture. Ayers, R.S and Westcott, D.W. FAO Irrigation and Drainage Paper No. 29, Rev 1. FAO, Rome. 174pp. FAO. (1990a). Water and sustainable Agricultural Development: A strategy for the implementation of Mar del Plata Action Plan for the 1990s. FAO, Rome. FAO. (1994b). Agricultural and Enviromenatl Legislation-Lithuania, Technical Report. B.G Appelgren. LED: TCPP/LIT/2352, Technical Cooperation Programme, FAO, Rome FAO. (2006). Control of Pollution from Agricultural, FAO Corporate Document Repository. www.iiste.org regulate the use of the fertilizers. An alternative system of keeping animals such as intensive system range defecation, building houses and dumping refuges, washing of clothes and vehicles at a distance close to the dam. There should be regular monitoring of plans and developments of the catchments areas of the dam to edition. Washington DC Lithuania, Technical Report . FAO-LEG: Attenborough, DN(1984). The living Planet Collins, British Broadcasting Coorporation, London and People in Humid Tropics, Past, Present and Future Hydrological Research for Integrated Land and Water Management, Cambridge University Press, Byrne K. (1997). Bath Advance Science. Enviromental Science. Second Edition, Nelson Thomas Delta Edition, 405-407pp Cunningham and Siago(1990). Enviromental Science, A Global Concern Wm. C, Dubuque, / a Bogota Daily Graphic Commentary (Tuesday, March 25, 2008) World Water Day, Protecting Water Sources, Issue . Renewable Natural Resources. Westview press. Inc. New York, 316pp ECAPH (1992). Water quality, analysis and management. Book Aid International, the Open University, inst Eutrophication. United Nations Commission for Europe, European Inland Fisheries Advisory Commission (EIFAC), (1964). Water Quality Criteria for European ns, Rome, EIFACI. 21pp Extence, CA. (1978). The effects of motorway construction on the urban stream Environmental Pollution 17: FAO. (1984). Enivromental Management for Vector control in rice fields. T.H. Mather. Irrigation and FAO.(1985). Water quality for Agriculture. Ayers, R.S and Westcott, D.W. FAO Irrigation and Drainage FAO. (1990a). Water and sustainable Agricultural Development: A strategy for the implementation of the Lithuania, Technical Report. B.G Appelgren. n from Agricultural, FAO Corporate Document Repository.
- 9. This academic article was published by The International Institute for Science, Technology and Education (IISTE). The IISTE is a pioneer in the Open Access Publishing service based in the U.S. and Europe. The aim of the institute is Accelerating Global Knowledge Sharing. More information about the publisher can be found in the IISTE’s homepage: http://www.iiste.org CALL FOR PAPERS The IISTE is currently hosting more than 30 peer-reviewed academic journals and collaborating with academic institutions around the world. There’s no deadline for submission. Prospective authors of IISTE journals can find the submission instruction on the following page: http://www.iiste.org/Journals/ The IISTE editorial team promises to the review and publish all the qualified submissions in a fast manner. All the journals articles are available online to the readers all over the world without financial, legal, or technical barriers other than those inseparable from gaining access to the internet itself. Printed version of the journals is also available upon request of readers and authors. IISTE Knowledge Sharing Partners EBSCO, Index Copernicus, Ulrich's Periodicals Directory, JournalTOCS, PKP Open Archives Harvester, Bielefeld Academic Search Engine, Elektronische Zeitschriftenbibliothek EZB, Open J-Gate, OCLC WorldCat, Universe Digtial Library , NewJour, Google Scholar