
Recomendados
Recomendados
Mais conteúdo relacionado
Destaque
Destaque (20)
Semelhante a memoria_48579941P
Semelhante a memoria_48579941P (20)
memoria_48579941P
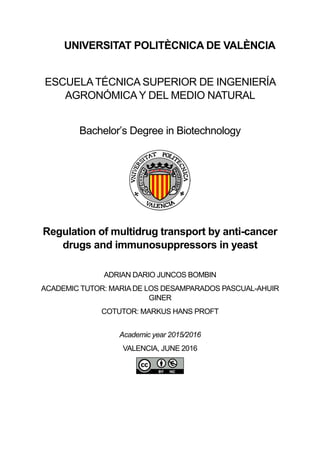
- 1. UNIVERSITAT POLITÈCNICA DE VALÈNCIA ESCUELA TÉCNICA SUPERIOR DE INGENIERÍA AGRONÓMICA Y DEL MEDIO NATURAL Bachelor’s Degree in Biotechnology Regulation of multidrug transport by anti-cancer drugs and immunosuppressors in yeast ADRIAN DARIO JUNCOS BOMBIN ACADEMIC TUTOR: MARIA DE LOS DESAMPARADOS PASCUAL-AHUIR GINER COTUTOR: MARKUS HANS PROFT Academic year 2015/2016 VALENCIA, JUNE 2016
- 2. I Título: Regulación del transporte multi-droga por fármacos antitumorales e inmunosupresores en levadura. Resumen: Hongos (levaduras) y células humanas tienen sistemas de defensa contra una gran diversidad de compuestos químicos (toxinas, drogas, fármacos, etc). Estas respuestas adaptativas se llaman generalmente “Resistencia pleiotrópica a drogas” o “Pleiotropic Drug Resistance (PDR)”. La activación de PDR en hongos puede causar una hiperresistencia de hongos patógenos a tratamientos anti fúngicos y en células humanas puede causar la resistencia a tratamientos antitumorales. La parte central de PDR forman múltiples activadores transcripcionales que activan la expresión génica de diferentes tipos de transportadores de la familia ABC. El resultado de la activación de PDR es la sobreexpresión de uno o varios exportadores multi-droga que ayuda a la célula a bajar los niveles intracelulares del compuesto químico. En levadura son los activadores del tipo “zinc cluster” como Pdr1, Pdr3 y otros que se encargan de la rápida activación transcripcional de genes que codifican transportadores multi-droga como PDR5, PDR15, SNQ2, YOR1 y otros a través de secuencias promotoras denominadas PDRE (“Pleiotropic Drug Resistance Element”). Aún no se entiende como una gran diversidad de compuestos químicos activa una defensa PDR específica para cada droga o toxina. En este trabajo queremos estudiar y, si es posible, descifrar genéticamente la activación transcripcional de varios transportadores multi-droga en la levadura Saccharomyces cerevisiae en respuesta a distintas moléculas de uso antitumoral y antiinflamatorio. Como herramienta experimental se aplicará el sistema reportero de la luciferasa desestabilizada (lucCP+ ) para cuantificar en tiempo real e in vivo la activación de la expresión génica en respuesta a los diferentes fármacos. Se usarán cepas de levadura que tienen fusionados con lucCP+ varios promotores de genes para transportadores multidroga como PDR5, PDR15, SNQ2 y YOR1. En los tratamientos químicos se incluirán, entre otros, los siguientes agentes: Menadiona (tratamiento control para la inducción de PDR en levadura), Paclitaxel (agente anti cancerígeno), Doxorrubicina (antibiótico de la familia de antraciclinas con amplias aplicaciones en quimioterapia), Ciclosporina A (potente supresor del sistema inmune con aplicaciones en el trasplante de órganos) y Rapamicina (inmunosupresor utilizado en el trasplante de órganos). Se determinará la respuesta dependiente de la dosis de cada compuesto para la comparación cuantitativa de los distintos transportadores. Adicionalmente se aplicará otro sistema reportero que consiste en lucCP+ codificada en plásmido bajo el control de varios elementos PDRE. Este abordaje experimental permitirá estudiar de forma cuantitativa la sensibilidad a cada compuesto químico de los factores de transcripción de la familia Pdr1. En resumen, el presente trabajo está diseñado para determinar las sensibilidades de control transcripcional de PDR en levadura y la implicación de diferentes factores específicos de transcripción en la respuesta a fármacos de estructura diferente. Palabras clave: expresión génica; regulación transcripcional, transporte multi-drug, resistencia pleiotrópica a drogas, Saccharomyces cerevisiae. Autor: D. Adrián Darío Juncos Bombín. Localidad y fecha: Valencia, junio de 2016. Tutor académico: Prof. Dña. María de los Desamparados Pascual-Ahuir Giner. Cotutor: D. Markus Hans Proft. Tipo de licencia de autorización de acceso y difusión del TFG: Creative Commons: Reconocimiento – NoComercial (by-nc)
- 3. II Title: Regulation of multidrug transport by anti-cancer drugs and immunosuppressors in yeast. Abstract: Fungi (yeasts) and human cells have developed defense systems against a wide variety of chemical compounds (toxins, drugs, etc). These adaptive responses are known as the "Pleiotropic Drug Resistance (PDR)". Activation of PDR in fungi can cause a hyperresistance against antifungal treatments and can cause resistance to antitumor treatments in human cells. The central part of PDR form multiple transcriptional activators that activate gene expression of different types of ABC transporters. Result of the activation of PDR is the overexpression of one or more multidrug exporters which help the cell to lower the intracellular levels of the chemical. In yeast, activators such as the "zinc cluster" proteins Pdr1, Pdr3 and others are responsible for the rapid transcriptional activation of genes encoding drug transporters such as PDR5, PDR15, SNQ2, YOR1 and others through promoter sequences called PDRE ("Pleiotropic Drug Resistance Element"). It is not yet understood how a wide variety of chemical compounds activate the defense through PDR in a specific manner for each drug or toxin. In the proposed work we will examine and, if possible, genetically decipher the transcriptional activation of several multidrug transporter genes in the yeast Saccharomyces cerevisiae in response to different therapeutical molecules with anti-tumor and anti-inflammatory characteristics. As an experimental tool, a reporter system based on destabilized luciferase (lucCP+) will be applied to quantify in real time and in vivo the activation of gene expression in response to different drugs. Yeast strains with several promoters of genes for drug transporters such as PDR5, PDR15, SNQ2 and YOR1 fused to lucCP+ will be used. The following chemical agents will be applied: Menadione (control treatment for induction of yeast PDR), Paclitaxel (anti-cancer agent), doxorubicin (antibiotic anthracycline family member with extensive applications in chemotherapy), Cyclosporine A (potent suppressor of the immune system with applications in organ transplantation) and Rapamycin (immunosuppressant used in organ transplantation). The dose-dependent response to each compound will be determined for the quantitative comparison of the different drug transporters. Additionally, another reporter system will be applied consisting of lucCP+ encoded in plasmids under the control of various PDRE elements. This experimental approach allows to quantitatively study the sensitivity to each chemical compound conferred by the different transcription factors of the PDR1 family. In summary, this study is designed to determine the sensitivity of transcriptional control in yeast PDR and the involvement of different specific transcription factors in the response to drugs of different structure. Key words: gene expression, transcriptional regulation, multi-drug transport, pleiotropic drug resistance, Saccharomyces cerevisiae.
- 4. III INDEX 1. INTRODUCTION............................................................................................................................1 1.1. Multiple drug resistance, ABC transporters and their role in human diseases ......................1 1.2. Mechanism of action of menadione, cyclosporine A, doxorubicin, paclitaxel and rapamycin 2 1.3. The importance of multi-drug resistance in Saccharomyces cerevisiae.................................6 1.4. Luciferase as a reporter system to analyse transient gene expression..................................7 2. OBJECTIVES.................................................................................................................................10 3. MATERIALS AND METHODS.....................................................................................................11 3.1. Yeast strains ..........................................................................................................................11 3.2. Preparation of drug stocks....................................................................................................12 3.3. Culture media........................................................................................................................12 3.4. Real-time measurement of luciferase activity in living yeast cells cultured with drugs.......13 3.5. Drop test of living yeast cells cultured with drugs................................................................15 4. RESULTS AND DISCUSSION.......................................................................................................16 4.1. Real-time quantification of the transcriptional dose-response of ABC transporter genes and the PDRE element upon menadione stress ......................................................................................16 4.2. Sensitivity of the employed PDR-lucCP+ reporter strains to menadione..............................17 4.3. Real-time quantification of the transcriptional dose-response of ABC-transporters and the PDRE upon paclitaxel stress..............................................................................................................18 4.4. Real-time quantification of transcriptional dose-response of ABC-transporter genes and the PDRE upon cyclosporine A stress ...............................................................................................19 4.5. Real-time quantification of the transcriptional dose-response of ABC-transporter genes and the PDRE upon doxorubicin stress.............................................................................................21 4.6. Real-time quantification of the transcriptional dose-response of ABC-transporter genes and the PDRE upon rapamycin stress ...............................................................................................22 4.7. pH dependence of yeast growth inhibition by various drug treatments .............................23 4.8. Real-time quantification of the transcriptional dose-response of SNQ2-lucCP+ upon menadione stress at different pHs ...................................................................................................26 4.9. Real-time quantification of the dose-response of PDRE driven gene expression upon menadione stress at different pHs ...................................................................................................26 4.10. Real-time quantification of the dose-response of SNQ2-lucCP+ upon doxorubicin stress at different pHs.................................................................................................................................28 4.11. Real-time quantification of the dose-response of the PDRE upon doxorubicin stress at different pHs .....................................................................................................................................29 4.12. Real-time quantification of the dose-response of in SNQ2-lucCP+ upon stress with cyclosporine A at different pHs.........................................................................................................30
- 5. IV 4.13. Real-time quantification of the dose-response of the PDRE upon cyclosporine A stress at different pHs .....................................................................................................................................30 4.14. Final assessment about the discussion of the results obtained in the thesis...................32 5. CONCLUSIONS ............................................................................................................................34 6. REFERENCES................................................................................................................................35
- 6. V INDEX OF FIGURES AND TABLES Figure 1. Schematic functioning and structure of ABC-transporters......................................................2 Figure 2. Ascorbate-driven menadione redox cycling ............................................................................3 Figure 3. Structure of cyclosporine A in its complex form with cyclophilin 18 and its unbound form ..4 Figure 4. Structure and principal action mechanism of doxorubicin......................................................4 Figure 5. Chemical structure of paclitaxel ..............................................................................................5 Figure 6. Chemical structure of rapamycin.............................................................................................6 Figure 7. Schematic representation of the luciferase reporter system functioning...............................9 Figure 8. Dose-response behaviour of various ABC-transporter genes and the PDRE upon menadione exposure ...............................................................................................................................................17 Figure 9. Comparison of the menadione sensitivity of yeast wild type cells with the different ABC- transporter gene fusion strains used in this thesis...............................................................................18 Figure 10. Dose-response behaviour of various ABC-transporter genes and PDRE upon paclitaxel exposure ...............................................................................................................................................24 Figure 11. Dose-response behaviour of various ABC-transporter genes and PDRE upon cyclosporine A stress.....................................................................................................................................................21 Figure 12. Dose-response behaviour of various ABC-transporter genes and PDRE upon doxorubicin stress.....................................................................................................................................................22 Figure 13. Dose-response behaviour of various ABC-transporter genes and PDRE upon rapamycin stress.....................................................................................................................................................24 Figure 14. Drug sensitivity assays performed with a wild type yeast strain at different pH ................25 Figure 15. pH dependence of the SNQ2 dose-response upon menadione exposure ..........................27 Figure 16. pH dependence of the PDRE-driven gene expression upon menadione exposure.............28 Figure 17. Dose-response profiles of SNQ2 upon doxorubicin stress at different pHs ........................29 Figure 18. Dose response profiles of PDRE-driven gene expression upon doxorubicin stress at different pHs .........................................................................................................................................30 Figure 19. Dose-response profiles of the SNQ2 gene upon cyclosporine A stress at different pHs.....31 Figure 20. Dose-response profiles of PDRE-driven gene expression upon cyclosporine A stress at different pHs .........................................................................................................................................32 Table 1. Yeast strains employed during the thesis .................................................................................8
- 7. VI Abbreviations µL: microliters µM: micromolar ABC: ATP-binding cassette AIDS: acquired immune deficiency syndrome ATP: adenosine triphosphate BCRP: breast cancer resistance protein DMSO: dimethyl sulfoxide DNA: deoxyribonucleic acid g: grams GFP: green fluorescent protein His: histidine HIV: human immunodeficiency virus KanMX: kanamycin L: litres Leu: leucine LucCP+ : destabilized luciferase MDR: multiple drug resistance Met: methionine mg: milligrams Min: minutes mL: millilitres mM: millimolar mRNA: messenger RNA MtCK: mitochondrial creatine kinase mTOR: mammalian target of rapamycin NBD: nucleotide-binding domain NFATc: nuclear factor of activated T cells nm: nanometres OD: optical density PDR: pleiotropic drug resistance
- 8. VII PDRE: pleiotropic drug resistance element PXR: pregnane X receptor RNA: ribonucleic acid ROS: reactive oxygen species SD: synthetic defined TMD: transmembrane domain Tris: tris(hydroxymethyl)aminomethane Ura: uracil WT: wild type YNB: yeast nitrogen base YPD: yeast extract peptone dextrose
- 10. 1 1. Introduction 1.1. Multiple drug resistance, ABC transporters and their role in human diseases Even with the improvements achieved in chemotherapy, cancer treatment still faces a major problem: the tolerance of cancer cells to chemical agents by a mechanism called multiple drug resistance (MDR). This phenomenon is not well understood yet and several theories have been proposed, being one of the most accepted the overexpression of adenosine triphosphate (ATP)- binding cassette (ABC) transporters in tumour cells, acting as pumps and provoking the efflux of different classes of antineoplastic drugs from these cells. This is why research into the deeper understanding and inhibition of these transporters has gained interest during the last decades (K. Tiwari et al., 2011; Binkhathlan and Lavasanifar, 2013; Baguley, 2010). These ubiquitous proteins, which comprise very heterogeneous classes of transport molecules, belong to one of the biggest and oldest superfamilies, categorized in seven subfamilies, from A to G, according to the Human Genome Organization (Dean, 2001; Verrier et al., 2008; GENENAMES, 2016). They were first discovered in the 1970s in bacteria as part of their nutrient uptake system, but it was not until the realisation of their ability to confer MDR to cancer cells when they were profoundly taken into consideration. Nevertheless, its importance is not only limited to cancer treatment, since it has also been observed that this superfamily of proteins is related to other human diseases like cystic fibrosis, bile salt transport disorders, Tangier disease, retinal degeneration, sterol transport deficiencies, obstetric cholestasis, etc., as well as being the cause of antifungal and antibiotic resistance in microorganisms (Higgins, 2001; Dean, 2001). All ABC transporters share a common structure consisting of two cytoplasmic nucleotide- binding domains (NBDs) and two transmembrane domains (TMDs), which are the main units of the transporter. NBDs work by binding and hydrolysing ATP, thus providing the necessary energy to activate the TMDs in which different molecules flow in and out of the cell (Figure 1a). Typically, TMDs are constituted by alpha-helical transmembrane segments, and each TMD subunit may contain from 5 to 10 of these alpha-helical structures, having the whole transporter from 10 to 20 transmembrane helices (Figure 1b). Obviously, NBD subunits are well conserved in primary and secondary structure in evolution since its function (binding and hydrolysing ATP) is conserved, whereas TMD subunits vary greatly in amino acid sequence, thus being able to recognise diverse molecules and resulting in “promiscuity” for different substrates (Lamping et al., 2010; Rice et al., 2014). From all the different proteins involved in the dynamic ABC transporters superfamily, ABCB1 has been proven to play a key role during cancer development. ABCB1 was the first identified human ABC protein, and first defined as a P-glycoprotein, implying to be a membrane protein which reduced the rate of colchicine permeability in Chinese hamster ovary cells, and thus participating in cancer cells MDR (Juliano and Ling, 1976). It can generally be found at high levels on the surface of epithelial cells of the whole body. Specifically, it is present in kidney, hepatocytes, pancreas and intestine, and in blood-tissue barriers like placenta and the blood-brain barrier, where it is involved in the mobilisation of substrates toward the blood (Eckford and Sharom, 2009). The research effort placed on this protein can be explained by its promotion of MDR in diseases like cancer and AIDS (Loo et al., 2013) having a very wide spectrum of substrate specificity that cover different drugs: analgesics like morphine, antibiotics such as rifampicin and tetracycline, anticancer drugs like colchicine, paclitaxel and doxorubicin, immunosuppressant agents like cyclosporine A, HIV-protease inhibitors, etc. (Chen et al., 2016). In the same way, another ABC transporter that confers resistance to anticancer drugs and other xenobiotics is breast cancer resistance protein (BCRP), which has also been the topic of abundant
- 11. 2 Figure 1. Schematic functioning and structure of ABC-transporters Proposed representation of a typical ABC transporter. a) Simplified mechanism of molecule efflux mediated by ATP hydrolysis: the molecule to be expelled from the cell is first recognised by the transmembrane proteins; ATP is recruited and hydrolysed; a conformational change in the TMD subunit results in the release of the molecule (Chen et al., 2016). b) Schematic topology of TMDs, having each one 6 alpha-helical transmembrane domains in this case (Prasad and Goffeau, 2012). research (Jani et al., 2014). A lot of different human transporter proteins taking part in MDR events have been identified, though they are not placed in the scope of this thesis, which will focus on the homologous process occurring in the yeast Saccharomyces cerevisiae. 1.2. Mechanism of action of menadione, cyclosporine A, doxorubicin, paclitaxel and rapamycin In this section, a brief explanation about the structure and function of the different drugs used in this thesis will be given: menadione, cyclosporine A, doxorubicin, paclitaxel and rapamycin. In the first place, menadione, also known as vitamin K3, is a lipophilic vitamin and a quinone compound, being involved in blood clotting as well as contributing to oxidative stress as a consequence of the redox cycling of this compound, but its biological role is more diverse than that, having functions in the correct bone structure formation, in carbohydrate storage, etc. Although menadione metabolism can happen by a two-electron reduction, the already mentioned redox cycling of menadione, which can be induced by ascorbate (vitamin C), happens by a one-electron reduction and is related to a strong oxidative stress, which is very useful as an anticancer strategy since cancer cells are particularly vulnerable to disruptions in redox homeostasis (Chiou et al., 1997; Beck et al., a b a
- 12. 3 2009; Hassan, 2013). Thus, the quinone (menadione) is reduced to form a semiquione, which is rapidly reoxidated back to the quinone form, leading to the generation of reactive oxygen species (ROS, particularly hydrogen peroxide), which produce oxidative stress (Figure 2). More specifically, it has been shown that this mechanism is also present in Saccharomyces cerevisiae and that a general response against the toxicity of menadione involves the action of glutathione transferases, and that strains deficient for that enzyme resulted in an increased sensitivity to menadione (Castro et al., 2008). Figure 2. Ascorbate-driven menadione redox cycling Acorbate (left) is able to reduce menadione (center, bellow) to a semiquinone free radical (center, up), which is then oxidized back by molecular oxygen (right) to its quinone form and results in the formation of a superoxide anion, which can subsequently generate hydrogen peroxide (Beck et al., 2009). Cyclosporin A is an immunosuppressant drug widely used in organ transplantation to prevent rejection, and can be used in certain diseases like proteinuria, focal segmental glomerulosclerosis (associated with kidney failure), etc. Furthermore, understanding the molecular mechanisms that control the action of cyclosporine A is important for the design of novel treatments for hepatitis C (Meyrier, 1999; Yang et al., 2015; Li et al., 2015). The immunosuppressive activity of this drug involves the inhibition of the calcineurin protein in lymphocyte T cells after having targeted cyclophilin 18. Cyclophilin 18 is a peptidyl-prolyl cis/trans isomerase which intervenes in processes of protein folding and it has been demonstrated that this molecule is required for the HIV-1 life cycle. In this way, only the cyclophilin 18 – cyclosporine A complex (Figure 3) can inhibit calcineurin, which is a phosphatase that can dephosphorylate and thus activate nuclear factor of activated T cells (NFATc), a transcriptional factor that can promote the transcription of interleukin 2, which is crucial in the activation of the T cell response (Luban, 1996; Yamashita et al., 2000; Zhang et al., 2004; Lin et al., 2016).
- 13. 4 Figure 3. Structure of cyclosporine A in its complex form with cyclophilin 18 and its unbound form Cyclosporine A has four hydrogen bonds in its unbound form (right), indicated by discontinuous lines, and a cis amide bond, indicated by the arrow. Upon binding to cyclophilin 18, the hydrogen bonds disappear and the cis bond turns into a trans bond (left), causing a dramatic conformational change in cyclosporine A. These changes are supposed to be essential for the subsequent ability of the cyclosporine A – cyclophilin 18 complex to inhibit calcineurin (Zhang et al., 2004). Doxorubicin belongs to the family of anthracyclines and was isolated for the first time from the bacterium Streptomyces peucetius in the early 1960s (Minotti, 2004). In the subsequent years, it was demonstrated that it is one of the strongest antineoplastic drugs available, and can be prescribed alone or in combination with other anticancer chemicals. It has a wide activity spectrum, being able to improve the condition of patients suffering from solid and haematological tumours such as breast, bile products, ovary, stomach and liver cancers, soft tissue sarcomas, lymphoblastic leukaemia, etc (Danesi et al., 2002; Sullivan, 2008). The major action mechanism of doxorubicin has been reported to be based on its capability to intercalate into the DNA double helix or form complexes with proteins which take part on DNA replication and transcription, both nuclear and mitochondrial, once it has entered in the cell by simple diffusion and translocated to the nucleus by binding to the proteasome (Figure 4). Therefore, cell death comes as a consequence of the inhibition of DNA, RNA and protein synthesis because of the topoisomerase activity of doxorubicin, which causes the DNA unwinding Figure 4. Structure and principal action mechanism of doxorubicin a) Chemical structure of the anthracycline doxorubicin, which can also possess sugar and aglyconic moieties. It is interesting to note that the side chain of this molecules ends with a primary alcohol. b) The most probable mechanism of toxicity is based on the entering of doxorubicin in the cell by simple diffusion and its binding to the proteasome present in the cytoplasm (step 1). Then, this complex is translocated to the nucleus through nuclear pores (step 2), where it binds and intercalates through the DNA double helix as a result of a higher affinity of doxorubicin for DNA than for the proteasome (step 3). Moreover, the drug can enter mitochondria by binding the mitochondrial creatine kinase (MtCK). The subsequent accumulation of doxorubicin inside mitochondria results in an increase of ROS (Sullivan, 2008). followed by the cleavage of one strand and the interaction with the other strand through the temporary cleavage site. Then, doxorubicin inhibits the fixing of this duplex, triggering an apoptotic response (Sullivan, 2008). Paclitaxel is a natural, therapeutic compound extracted from natural the stem bark of Taxus brevifolia with wide applications as an anticancer drug (Wani et al., 1971). Along with other semi- synthetic derivatives, it is used to treat a big variety of different tumours, like lung, breast, ovarian, gastric and prostate cancer, among others (Wen et al., 2016). It has been reported to interfere with the microtubules array in the cell and thus promote mitotic arrest, finally leading to apoptosis (Schiff a b
- 14. 5 et al., 1979). Nevertheless, there is a limitation with respect to the natural obtaining of this compound as well as to the difficulty that supposes its chemical synthesis and the development of MDR processes in cancer cells that enables them to eliminate this drug (Orr et al., 2003; Wen et al., 2016). There have been proposed several mechanisms of action which can explain the biological properties of paclitaxel. For example, one of them is related to its chemical structure, which can be seen in Figure 5, consisting in a tricyclic diterpenoid core and a side chain. In this way, according to some authors, its side chain composed of 13 carbon atoms may be directly related to its anticancer activity (He et al., 2000; Wen et al., 2016). On the other hand, as other compounds with different chemical structures but sharing the same mechanism and biding sites with paclitaxel were discovered, a new theory that highlights the role of the diterpenoid scaffold has been proposed (Ojima et al., 1999). This variety of proposed mechanisms opens the door for researchers to develop paclitaxel analogues with improved antineoplastic functions to test their efficacy. Figure 5. Chemical structure of paclitaxel Paclitaxel is formed by a C-13 side chain and a [6 + 8 + 6] tricyclic diterpenoid core (CHEMICALBOOK, 2016) Rapamycin is a natural, lipophilic macrolide (Figure 6) produced by the bacterium Streptomyces hygroscopicus that was brought to attention for the first time in the Easter island (Vézina et al., 1975). Among other activities that this drug possesses, it was eventually discovered its ability to inhibit protein synthesis by interfering with the amino acid incorporation to the growing peptide chain and, most importantly, it was also reported its ability to cause immunosuppression. The activity of rapamycin can be explained by the effect that it has in the mammalian target of rapamycin (mTOR), which is a member of the big kinase family that plays a wide variety of roles inside the cell including the contribution to cell growth, cytoskeletal organization, mRNA turnover, etc. Its role in mRNA translation is mainly exerted by phosphorylating the ribosomal S6 kinase, so if rapamycin is present in the cell, it will prevent this phosphorylation by binding to mTOR (Arriola Apelo and Lamming, 2016; McKinsey and Kass, 2007). Moreover, the PI3K-AKT-mTOR pathway, that is, the proposed signal transduction cascade for the activation of mTOR, has been shown to be essential for the growth and activation of several immune cells, including natural killer, B and T cells because of the control that this pathway has over interleukin 2 and 15 production (Ali et al., 2015; Arriola Apelo and Lamming, 2016), which would explain the immunosuppressant effect that this drug can trigger.
- 15. 6 Figure 6. Chemical structure of rapamycin Rapamycin, also called sirolimus, is a macrocyclic triene natural compound that was first used as an antibiotic (REAGENTSDIRECT, 2016). 1.3. The importance of multi-drug resistance in Saccharomyces cerevisiae During the last decades, there has been an increase in opportunistic fungal infections in populations including cancer patients and people receiving an immunosuppressive treatment such as transplant recipients. Controversially, advances in medicine which led to a higher rate of survival in patients suffering from life-threatening illnesses have consequently led to a higher risk of contagion of these illnesses to other individuals. Therefore, though fungal infections were, decades past, considered clinically irrelevant, today a re-examination of these opportunistic microorganisms is needed. Death rate among infected individuals can be as high as 90%, being the genus Candida the most frequently pathogenic one and, more specifically, the yeast Candida albicans (Richardson, 2005). The study of antifungal resistance has lagged with respect to the study of antimicrobial resistance, not existing any standardized method to test the in vitro antifungal susceptibility of different fungi species to diverse chemicals (Klepser, 2006). Furthermore, the spread usage of antifungals over the last years has given rise to the MDR phenomenon in these yeasts. This acquired antifungal resistance, which adds up to the intrinsic resistance mechanisms, is a major drawback and a challenge to overcome these growing infections (Prasad et al., 2016). Thus, the molecular mechanisms of fungal MDR need to be understood in order to develop a novel generation of antifungal drugs with better effectivity. As in humans, fungal MDR is caused by the overexpression of ABC transporters which result in very low concentrations of different classes of drugs inside the cell, mediating pleiotropic drug resistance (PDR) in this way (Sipos and Kuchler, 2006). The selective activation of different MDR pathways can be explained by the transcription of the genes involved. Trans-acting transcription activators specifically bind certain sequences of DNA and then recruit transcriptional coactivators complexes such as the mediator coactivator to trigger RNA polymerase II association and subsequent gene activation. The requirements of coactivators to bind activators and induce gene transcription of xenobiotic-dependent genes (which are eventually responsible for the PDR) are not fully understood yet, and still remain a promising research field since new anti-MDR chemicals could be designed if the intrinsic mechanism of activator-coactivator- transcriptional machinery association was completely described (Näär et al., 2001; Kornberg, 2005). Some studies have tried to elucidate the transcriptional factors taking part in the MDR phenotype. Focus has been placed in C. glabrata, a yeast closely related to S. cerevisiae, because it
- 16. 7 also possesses a strong mechanism for MDR and, therefore, has raised clinical alarms in the USA when becoming the second most common cause of invasive candidiasis (Pfaller and Diekema, 2007). The group of Thakur et al. (2008) found that Pdr1p orthologues, which are transcriptional factors from S. cerevisiae and C. glabrata, can directly bind xenobiotics resulting in the activation of MDR genes encoding ABC transporters, in a mechanism related to that of the vertebrate foreign chemicals receptor PXR, which is involved in human detoxification pathways (Kliewer et al., 2002). Moreover, they also demonstrated that activation domains of Pdr1p orthologues can bind to a subunit of the mediator coactivator (Gal11p), which is structurally related with other human and vertebrate activator domains. Whereas the PDR1 gene encodes a regulator of gene expression, the PDR5 gene is directly related to MDR since it encodes a xenobiotic efflux pump, its amplification leading to increased resistance (Meyers et al., 1992). Pdr5p, the protein encoded in the PDR5 gene, is considered one of the most crucial MDR transporters in S. cerevisiae because it can detoxify a wide variety of compounds including azole antifungals, with some specificity overlapping with other homologous pleiotropic drug resistance proteins such as Snq2p and Yor1p (Kolaczowski et al., 1998). In a much more general view, as many articles from the last decades report, the most studied ABC genes of yeast displaying the so- called PDR phenotype are PDR5, SNQ2, PDR10, PDR15 and YOR1, and are controlled at the transcriptional level by the homologous proteins Pdr1p, Pdr3p and Yrr1p, containing a Zn(II)2Cys6-type zinc-finger motif, where the N-terminal cysteine rich zinc-finger binds DNA as a transcriptional activator (Balzi et al., 1987; Delaveau et al., 1994; Cui et al., 1998). ABC transporters in yeast have recently attracted research to test different drugs and inhibitors for the study of the PDR cellular response. For instance, it has been shown that Snq2p can confer resistance to caffeine in a more efficient way than Pdr5p in yeast cells (Tsujimoto et al., 2015). Moreover, a direct interaction between hexanol and the efflux proteins has been suggested, which provokes a strong inhibition of MDR at hexanol concentrations of 0.1% (Gášková et al., 2013). With respect to Yor1p, it has been proposed that it might provide resistance to oligomycin, rhodamine B, rhodamine 6G, doxorubicin and weakly to tetracycline and ethidium bromide, among others (Grigoras et al., 2008). To conclude with this section, researchers have reported a compensatory activation mechanism between the efflux pumps Pdr5p, Snq2p and Yor1p, presumably by means of the transcriptional factor Pdr1p (affecting the transcription of the cited ABC transporters as it was mentioned before): MDR to specific substrates of Pdr5p rose when the YOR1 or SNQ2 coding region was disrupted, and resistance to specific substrates of Yor1p and Snq2p rose when the PDR5 gene was deleted (Kolaczkowska et al., 2008). 1.4. Luciferase as a reporter system to analyse transient gene expression Yeast provides an excellent model to direct research and a good proof of that has constituted the fact that many breakthroughs in the conserved mechanisms that share all eukaryotes have been done using yeast (Hahn and Young, 2011). Moreover, in the final comments of his yeast transcriptional review, Struhl (1995) proposed some fundamental aspects that were to direct research in the following years, concerning the transcriptional system of the cell and all the side-regulatory elements which intervene on it. Research that employed yeast as a model organism contributed to expand the knowledge in the crucial areas that were proposed in the 90’s by Kevin Struhl (Hahn and Young, 2011). Consequently, yeast should also provide a solid system to further analyse the mechanisms for MDR, being the reporter system to study cellular transcription of the uttermost importance.
- 17. 8 Traditional methods to assess the transcriptional level of a certain gene are invasive and require the disruption of the cell. They are based on the isolation and measurement of the mRNA level of the gene of interest, or on a construction in which the desired promoter controls the expression of a reporter enzyme. This makes the differential studies for the expression of more than one gene very time consuming and difficult (Rienzo et al., 2012). The discovery of the green fluorescent protein (GFP) from jellyfish allowed the possibility to study the transcriptional activity inside the living cell in a relatively easy, instantaneous and non-invasive manner, as well as the elucidation of protein and organelle localization (Cormack, 1998). Nevertheless, this system was still far from perfection because in order to emit fluorescence, GFP needs to complete cycles of absorption/emission of photons, changing from an excited state to a ground state. The return to the ground state is just one of the several pathways that GFP can follow, being also possible to interact with other species resulting in electron transfer phenomena, yielding thermal deactivation, etc. (Pazos et al., 2009). In addition, the relatively high stability of GFP is a hindrance when analysing transient gene induction, where gene switch-off follows gene switch-on, or vice versa, having the need to employ a destabilized reporter molecule (Mateus and Avery, 2000). The identification of the firefly luciferase gene, which is able to catalyse a bioluminescent reaction, supposed a revolution in reporter systems. This method has been fast adapted to analyse gene expression in fungi, plants, insects and mammals (J. Miraglia et al., 2011). For example, luciferase from firefly promotes the oxidation of its substrate, luciferin, to oxyluciferin, consuming one ATP molecule and yielding oxyluciferin in an excited state, and pyrophosphate and carbon dioxide as byproducts. In the oxyluciferin transition from the excited state to the ground state, a photon is released, resulting in luminescence (Figure 7). Therefore, no previous light excitation is needed in these systems, optimizing the detection of gene expression or the desired protein and increasing the assay’s sensitivity (Fraga et al., 2006). Nowadays, this reporter system has been widely exploited, being employed in approximately 21% of assays in the PubChem database (Thorne et al., 2010). Nevertheless, a destabilized version of the luciferase enzyme and mRNA is needed in order to be able to evaluate transient gene expression. In the scientific literature, different articles employing short-lived versions of luciferase can be found. For example, calcineurin-dependent elements were identified using a destabilized luciferase with half-lives from 20 to 30 minutes in the yeast Schizosaccharomyces pombe (Deng et al., 2006) and oscillatory gene regulation assays were performed in S. cerevisiae (Robertson et al., 2008; Robertson and Johnson, 2011). In this thesis, the exact mechanism for firefly luciferase destabilization used is the one described by Rienzo et al. (2012): PEST and CL1 sequences are introduced in the luciferase coding region to facilitate protein degradation upon mRNA translation, and ARE sequence is introduced in the luciferase gene to
- 18. 9 Figure 7. Schematic representation of the luciferase reporter system functioning Light is produced upon the luciferase gene transcription, followed by the RNA translation and the interaction between the luciferase enzyme and its substrate. (THERMOFISHER, 2016). promote mRNA degradation. Thus, only when the reporter gen is actively being transcribed will the bioluminescence signal be registered.
- 19. 2. Objectives
- 20. 10 2. Objectives The specific objectives which led this thesis were: Determination of the transcriptional dose-response profiles of the ABC transporter genes PDR5, PDR15, SNQ2 and YOR1 upon exposure to the drugs menadione, paclitaxel, doxorubicin, cyclosporine A and rapamycin. Determination of the expression profile of an artificial pleiotropic drug resistance element (PDRE) driven reporter gene upon exposure to the same compounds just mentioned above. Determination of the pH dependence of the drug-induced gene expression and sensitivity in yeast cells.
- 22. 11 3. Materials and methods 3.1. Yeast strains A brief description of the Saccharomyces cerevisiae strains used in the experiments is shown in Table 1. Table 1. Yeast strains employed during the thesis Strain (Saccharomyces cerevisiae) Genotipe Origin Introduced construction (only for integrative strains) BY4741 (WT) MATa; his3Δ1; leu2Δ0; met15Δ0; ura3Δ0 EUROSCARF SNQ2-lucCP+ MATa; his3Δ1; leu2Δ0; met15Δ0; ura3Δ1 #1351 Laboratory strains collection SNQ2-lucCP+ -Cyc1Term- KanMX YOR1-lucCP+ MATa; his3Δ1; leu2Δ0; met15Δ0; ura3Δ2 #1463 Laboratory strains collection YOR1-lucCP+ -Cyc1Term- KanMX PDR5-lucCP+ MATa; his3Δ1; leu2Δ0; met15Δ0; ura3Δ3 #1352 Laboratory strains collection PDR5-lucCP+ -Cyc1Term- KanMX PDR15-lucCP+ MATa; his3Δ1; leu2Δ0; met15Δ0; ura3Δ4 # 1354 Laboratory strains collection PDR15-lucCP+ -Cyc1Term- KanMX BY4741 with plasmid pAG413-3xPDRE-lucCP+ MATa; his3Δ1; leu2Δ0; met15Δ0; ura3Δ5 # 1643 Laboratory strains collection The strains SNQ2-, YOR1-, PDR5- and PDR15-lucCP+ are integrative strains obtained by the insertion in the yeast genome at the corresponding ABC gene sequence of the destabilized luciferase coding sequence (lucCP+ ), followed by a selection gene which confers resistance to the antibiotic kanamycin (KanMX). This construction substitutes the corresponding endogenous ABC gene. The plasmid pAG413-3xPDRE-lucCP+ was obtained from the p413-CYC1Δ-lucCP+ plasmid constructed by Rienzo et al. (2012). CYC1Δ is a core promoter without transcriptional activator elements. The following PDR elements (PDRE) were inserted in the plasmid BspEI restriction site (at - 250 pb, upstream from the ATG start codon of lucCP+ ): BspEI-EcoRV-3xPdr1-1: 5’-CCGGCGATATCTCCGCGGATAGAATACATCCGCGGATCGCGATCATCCGCGGAT-3’ BspEI-EcoRV-3xPdr1-2: 5´-CCGGATCCGCGGATGATCGCGATCCGCGGATGTATTCTATCCGCGGAGATATCG-3´ The highlighted sequences are the PDRE sites that can bind to multiple transcriptional factors activated upon xenobiotic binding. Furthermore, the plasmid has a HIS3 gene for culture selection of transformed yeasts, which enables the cells to synthesize histidine. The yeast strain containing this plasmid will be referred to as 3xPDRE.
- 23. 12 3.2. Preparation of drug stocks The different antibiotics, immunosuppressive agents and anticancer drugs were first prepared from their solid, pure form, so they would already be ready in a liquid phase to perform the required assays. A 100 mM menadione stock, a strong oxidant which was used as positive control since it is known to activate PDR responses in yeast (Chen et al., 2007; Imrichova et al., 2005; Nguyên et al., 2000; Schnell et al., 1992), was prepared by diluting 0.172 g of solid menadione in 10 mL of dimethyl sulfoxide (DMSO). A 50 mM cyclosporine A stock, a strong immunosuppressive agent with applications in organ transplantation (MEDLINEPLUS, 2016), was prepared by diluting 0.5 g of solid cyclosporine A in 8.315 mL of DMSO. A 100 mM paclitaxel stock, an anticancer drug (Weaver, 2014), was prepared by diluting 0.1 g of the drug in 1.17 mL of DMSO. A 50 mM doxorubicin stock, an anthracycline antibiotic with applications in chemotherapy (MEDLINEPLUS, 2016), was prepared by diluting 25 mg of the drug in 0.862 mL of DMSO. A 100 mM rapamycin stock, an immunosuppressive agent used in organ transplantation (Saunders et al., 2001), was prepared by diluting 50 mg of the drug in 547 mL of DMSO. All stocks were kept at -20 ºC. 3.3. Culture media Yeast were grown in a solid Synthetic Defined (SD) medium after being defrosted from the stored laboratory strains collection. For the 3xPDRE strain, the SD medium contained: Yeast Nitrogen Base (YNB) 0.67%: 1.675 g. Glucose 2%: 5 g. Agar 2%: 5 g. Leucine 0.1 g/L: 0.025 g. Methionine 0.1 g/L: 0.025 g. Uracil 0.025 g/L: 0.00625 g. These solid compounds were placed in a flask and then 225 mL of deionized water were added. Three 500 mM succinic acid stocks were prepared with 29.52 g of solid succinic acid and 500 mL of deionized water, and they were adjusted to pH 3, 5 and 7 with solid tris(hydroxymethyl)aminomethane (tris). 25 mL of succinic acid at pH 5 were added to the 225 mL of deionized water in the flask with the solid compounds for the preparation of solid SD medium. Succinic acid stocks and the solid medium were autoclaved at 121 ºC for 20 minutes. Then, the still liquid medium was plated on different Petri dishes and they were let to dry and solidify. The same solid medium was prepared for the integrative yeast strains culture, adding 0.025 g of solid histidine (0.1 g/L) to the flask before autoclaving, since they are not able to synthesize that amino acid. Yeast strains were plated on their corresponding agar media and were kept in an incubator at 28 ºC for 1 day. Then, they were cultured in the corresponding liquid SD medium. Therefore, for the integrative strains, SD +His +Leu +Met +Ura medium was required, while the strain with the pAG413- 3xPDRE-lucCP+ plasmid required SD -His +Leu +Met +Ura medium (as the HIS3 gene is used as a
- 24. 13 selection marker, medium must not contain this amino acid so as to maintain the selective pressure and force yeast to preserve the plasmid). Liquid SD medium was prepared to preculture yeast strains on a normal basis for every experiment. The following quantities of solid compounds were added to a flask: YNB 0.67%: 3.35 g Glucose 2%: 10 g. Leucine 0.1 g/L: 0.05 g. Methionine 0.1 g/L: 0.05 g. Uracil 0.025 g/L: 0.0125 g. 450 mL of deionized water and 50 mL of succinic acid at the proper pH were added to the flask and was autoclaved at 121 ºC for 20 minutes. Another liquid SD medium was prepared containing the mentioned compounds plus 0.05 g of histidine (0.1 g/L) for the integrative strains. Liquid and solid yeast extract peptone dextrose (YPD) medium was prepared to perform drop tests. For the solid medium, the following substrates were added to a flask: Yeast extract 1%: 2 g. Peptone 2%: 4 g. Glucose 2%: 4 g. Agar 2%: 4 g. They were diluted in 200 mL of deionized water and the whole mixture was autoclaved at 121 ºC for 20 minutes. Then, the still liquid broth was plated on Petri dishes and they were let to dry and solidify. The same substrates were added to prepare the liquid YPD medium except agar, and the mixture was autoclaved in the same way. 3.4. Real-time measurement of luciferase activity in living yeast cells cultured with drugs The procedure employed in this thesis was inspired by the protocol described in Rienzo et al. (2012). Yeast were cultured overnight in a roller at 30 ºC in test tubes containing 4 mL of liquid SD medium. Integrative yeast strains were cultured in liquid SD +His +Leu +Met +Ura medium while the strain with the plasmid was cultured in liquid SD -His +Leu +Met +Ura medium. Depending on the assay, medium with 50 mM succinic acid at pH 3, 5 or 7 was used. The following day, test tubes having an optical density (OD) of 1.5-2.0 at 600 nm were selected, and were preincubated for 90 minutes in a roller at 30 ºC with 200 µL of 10 mM luciferin. The culture was then distributed in 135 µL aliquots in white 96-well plates (Nunc), along with 15 µL aliquots of the required drug at the required concentration. In the first set of experiments, the following aliquots were taken from the 100 mM stocks of menadione, paclitaxel and rapamycin: 20 µL of the 100 mM drug stock and 1 mL of the appropriate liquid SD medium (at a pH 3) for a concentration of 2,000 µM, which was reduced 1/10 when it was distributed in the 96-well plates (15 µL of 2,000 µM diluted drug with 135 µL of yeast aliquots) for a final concentration of 200 µM.
- 25. 14 10 µL of the 100 mM drug stock and 1 mL of the appropriate liquid SD medium (at a pH 3) for a concentration of 1,000 µM, which was reduced 1/10 when it was distributed in the 96-well plates (15 µL of 1,000 µM diluted drug with 135 µL of yeast aliquots) for a final concentration of 100 µM. 5 µL of the 100 mM drug stock and 1 mL of the appropriate liquid SD medium (at a pH 3) for a concentration of 500 µM, which was reduced 1/10 when it was distributed in the 96-well plates (15 µL of 500 µM diluted drug with 135 µL of yeast aliquots) for a final concentration of 50 µM. 2 µL of the 100 mM drug stock and 1 mL of the appropriate liquid SD medium (at a pH 3) for a concentration of 200 µM, which was reduced 1/10 when it was distributed in the 96-well plates (15 µL of 200 µM diluted drug with 135 µL of yeast aliquots) for a final concentration of 20 µM. 100 µL of the 1,000 µL drug dilution and 0.9 mL of the appropriate liquid SD medium (at a pH 3) for a concentration of 100 µM, which was reduced 1/10 when it was distributed in the 96- well plates (15 µL of 100 µM diluted drug with 135 µL of yeast aliquots) for a final concentration of 10 µM. 50 µL of the 1,000 µL drug dilution and 1 mL of the appropriate liquid SD medium (at a pH 3) for a concentration of 50 µM, which was reduced 1/10 when it was distributed in the 96-well plates (15 µL of 50 µM diluted drug with 135 µL of yeast aliquots) for a final concentration of 5 µM. 10 µL of the 1,000 µL drug dilution and 1 mL of the appropriate liquid SD medium (at a pH 3) for a final concentration of 10 µM, which was reduced 1/10 when it was distributed in the 96- well plates (15 µL of 10 µM diluted drug with 135 µL of yeast aliquots) for a final concentration of 1 µM. 20 µL of DMSO and 1 mL of the appropriate liquid SD medium (at a pH 3), which was used as a negative control to eliminate the possible background effect that DMSO may have in the transcriptional activity of the studied genes, since the stock in which the drugs were contained was prepared using DMSO as solvent. For the 50 mM stocks of doxorubicin and cyclosporine A, the dilutions were prepared in the same way but multiplied by 2. Therefore, 40, 20, 10 and 4 µL of the drug stocks were taken to dilute the drug and achieve a final concentration in the 96-well plates of 200, 100, 50 and 20 µM, respectively, and 200, 100 and 20 µL of the 1,000 µL drug dilution were taken to dilute the drug and achieve a final concentration of 10, 5 and 1 µM, respectively. When 200 and 100 µL of aliquot were taken, the liquid SD medium used as a solvent was of 0.8 and 0.9 mL, respectively. The negative control was prepared with 40 µL of DMSO. In the second set of experiments, the same experiment was repeated using a liquid SD medium of pH 3, 5 and 7. In this case, the final drug concentrations in the 96-well plates were of 200, 150, 100, 75, 50, 20 and 10 µM. They were prepared similarly with respect to the first set of experiments, taking aliquots of 20, 15, 10, 7.5, 5 and 2 from the 100 mM drug stocks (for menadione) to prepare dilutions of 2,000, 1,500, 1,000, 750, 500 and 200 µM (which were then diluted 1/10 in the 96-well plates). The final dilution of 100 µM was prepared with an aliquot of 50 µL from the 2,000 µM dilution. The aliquots taken from the 50 mM drug stocks (doxorubicin and cyclosporine A) were twice the quantity taken from the 100 mM drug stocks. For all the experiments, light emission was recorded every minute for 99 minutes in a GloMax 96 microplate luminometer (Promega) in three replicates for each drug concentration. Then, data were transferred to a Microsoft Excel sheet and a figure was constructed in which every discrete value
- 26. 15 of luminescence was normalized by calculating the average value of the 3 replicates for each drug concentration, and by dividing the resulting number by the value of that yeast culture’s OD to yield relative luminescence units in the Y axis. Time in minutes was used for the X axis. A corrected maximum absorbance figure was constructed for the menadione assays by subtracting the negative control replicates absorbance value (which corresponded to the DMSO treatment) to the corresponding maximum peak of absorbance of the treatment with every different drug concentration for every strain used. Moreover, a fold-induction curve was constructed to compare the assays performed at different pHs. The maximum absorbance for every strain in a single experiment was set to the arbitrary value of 100, and each other maximum absorbance value of that same strain’s experiment was corrected accordingly to that new arbitrary scale. The same factor was applied to correct the mean deviation. For all the figures, if the standard deviation was less than the 10% between each triplicate, error bars were not shown to facilitate the visualisation of the figures by reducing point density. 3.5. Drop test of living yeast cells cultured with drugs A first set of drop tests was performed by preparing solid YPD medium which, after autoclaving but being still in liquid state in three different flasks, was added 100, 200 and 400 µL of 100 µM drug stocks (menadione) to achieve a final concentration of 50, 100 and 200 µM, respectively, in each flask containing already 200 mL of YPD medium. Then, the liquid state YPD medium of each flask was plated in Petri dishes and was let to dry and solidify. Yeast cultures were prepared separately in 96-well plates. A preincubated 3 mL yeast culture in YPD was prepared the day before and was incubated overnight until saturation in a roller at 30 ºC. Then, a 20 µL aliquot was taken from that culture and was mixed with 180 µL fresh liquid YPD medium in a well of the 96-well plate. Two sequential 1/10 dilutions were performed for each strain (BY 4741 and all the integrative strains). Each well containing yeast cultures was plated on the Petri dishes containing solidified YPD medium with the respective drugs. Petri dishes were kept for 1 day in an incubator at 28 ºC and 1 day at room temperature, when finally a photo was taken with a conventional HP scanner. The second set of drop tests was performed by preparing yeast cultures in 100 µL of liquid SD medium at pH 3 and 7 in two different 96-well plate (one for each pH). In each plate, the drugs menadione, cyclosporine A, doxorubicin and paclitaxel were added up to a final concentration of 50, 100 and 200 µM, along with 10 µL of fresh yeast culture, which was sequentially diluted 1/10 twice. The wells were plated on Petri dishes containing solid YPD medium, and were incubated at 28 ºC. Photos were taken with a conventional HP scanner at 1, 3 and 22 hours.
- 28. 16 4. Results and discussion 4.1. Real-time quantification of the transcriptional dose-response of ABC transporter genes and the PDRE element upon menadione stress The constructed strains SNQ2-, YOR1-, PDR5-, PDR15-lucCP+ and 3xPDRE were submitted to a scale of different menadione concentrations in liquid SD media at pH 3. The dynamics of the dose- response behaviour of the genes SNQ2, YOR1, PDR5, PDR15 and the PDRE-driven gene expression was inferred by the quantification of the luciferase activity by means of the registration of light signal emission by yeast cells in a luminometer. Experiment results can be seen in Figure 8. For the strains SNQ2-lucCP+ (Figure 8a) and PDR15-lucCP+ (Figure 8d) the dose-response behaviour showed a concurrent increase: higher doses of menadione produced higher light emissions. SNQ2-lucCP+ experienced a dramatic increase in light signal for menadione concentrations of 50, 100 and 200 µM, (registering the highest peak of all strains tested) while PDR15-lucCP+ experienced weak luminescence signals only achieving significant values at a menadione concentration of 200 µM. Then, PDR5-lucCP+ (Figure 8c) and 3xPDRE (Figure 8e), were the strains which showed the non-concurrent responses for concentrations of 50 and 100 µM. PDR5-lucCP+ and 3xPDRE had their maximum light emission at a 0 500 1000 1500 2000 2500 3000 3500 1 9 17 25 33 41 49 57 65 73 81 89 97 Relativeluminiscenceunits Tiempo (min) SNQ2-lucCP+ + menadione 0 µM 1 µM 5 µM 10 µM 20 µM 50 µM 100 µM 200 µM 0 10 20 30 40 50 60 1 9 17 25 33 41 49 57 65 73 81 89 97 Relativeluminiscenceunits Time (min) YOR1-lucCP+ + menadione 0 µM 1 µM 5 µM 10 µM 20 µM 50 µM 100 µM 200 µM 0 500 1000 1500 2000 2500 1 9 17 25 33 41 49 57 65 73 81 89 97 Relativeluminiscenceunits Time (min) PDR5-lucCP+ + menadione 0 µM 1 µM 5 µM 10 µM 20 µM 50 µM 100 µM 200 µM 0 100 200 300 400 500 600 1 9 17 25 33 41 49 57 65 73 81 89 97 Relativeluminiscenceunits Time (min) PDR15-lucCP+ + menadione 0 µM 1 µM 5 µM 10 µM 20 µM 50 µM 100 µM 200 µM a b c d
- 29. 17 Figure 8. Dose-response behaviour of various ABC-transporter genes and the PDRE upon menadione exposure Relative luminescence units recorded as a function of time using menadione as a stress factor and relative corrected luminescence as a function of menadione concentration. The experiments were performed in triplicates. The standard deviation was lower than the 10% for each replicate, so error bars are not shown to reduce the point density and facilitate visualisation of the figures (figures 8a, 8b, 8c, 8d and 8e). a) response of SNQ2-lucCP+ strain; b) response of YOR1-lucCP+ strain; c) response of PDR5-lucCP+ strain; d) response of PDR15-lucCP+ strain; e) response of 3xPDRE strain. f) Comparison of relative corrected luminescence units as a function of menadione concentration of all strains used. concentration of 100 µM, decreasing at a concentration of 200 µM. In the case of PDR5-lucCP+ , this drop in luminescence was very significant, whereas for 3xPDRE it was not so pronounced. The strain YOR1-lucCP+ (Figure 8b) showed no light emission whatsoever for any menadione concentration. Taken together (Figure 8f), the strain which showed the maximum sensitivity and induction was SNQ2- lucCP+ since it needed low concentrations of menadione to the highest. PDR5-lucCP+ also showed a similar induction but luminescence signal decayed for a menadione concentration of 200 µM. This result may suggest that the most relevant gene to promote a menadione efflux out of yeast cells is SNQ2 since it shows the best response kinetics for this drug. PDR5, SNQ2 and PDRE showed a sensitive response to menadione since their initial activation, inferred by the increase in luminescence, was similar for most of the menadione concentrations used. On the contrary, PDR15 and YOR1 showed both weak sensitivity and induction. PDR5 and SNQ2 differ in the maximum response to menadione, showing SNQ2 in this case more induction (its maximum response being at 200 µM for this experiment; the real maximum response may be even at higher menadione concentrations). PDR5 and PDRE had a similar maximum response, at a menadione concentration of 100 µM for this experiment. Therefore, it seems reasonable that SNQ2, PDR5 and PDRE (in natural genes) might be responsible for menadione response. PDR15 and YOR1 might be targeted by other factors participating in other specific MDR pathways against other xenobiotics. 4.2. Sensitivity of the employed PDR-lucCP+ reporter strains to menadione PDR-lucCP+ integrative strains are mutants for the respective transporter genes. To further elucidate whether the mutations of ABC-genes lead to an increased sensitivity to menadione and therefore to different dose-response profiles, sensitivity tests of all strains were performed in a drop test on agar plates containing YPD media supplemented with different menadione concentrations (50, 100 and 200 µM). 3xPDRE strain was not tested in this assay since it was not an integrative strain and, 0 200 400 600 800 1000 1200 1400 1600 1800 1 9 17 25 33 41 49 57 65 73 81 89 97 Relativeluminiscenceunnits Time (min) 3xPDRE + menadione 0 µM 1 µM 5 µM 10 µM 20 µM 50 µM 100 µM 200 µM e 0 500 1000 1500 2000 2500 3000 3500 0 100 200 Relativecorrectedluimniscenceunits Menadione concentration (µM) Corrected maximum absorbance PDR5 PDR15 SNQ2 YOR1 3xPDRE f
- 30. 18 Figure 9. Comparison of the menadione sensitivity of yeast wild type cells with the different ABC-transporter gene fusion strains used in this thesis. Drop tests for integrative and control strains on YPD Petri dishes supplemented with menadione: a) yeast strains growth test for a menadione concentration of 50 µM; b) yeast strains growth test for a menadione concentration of 100 µM and c) test strains growth test for a menadione concentration of 200 µM. therefore, had no changes in its endogenous multi-drug transporters. Wild type strain BY4741 was employed as a control. The results of this test can be observed in Figure 9. No differences in growth could be observed in any strain when the same menadione concentration was used, as compared with the control. Therefore, increasing concentrations of menadione do not have differential detrimental effects for different strains, and they rather have the same susceptibility for every menadione concentration, thus differential dose-response profiles obtained in Figure 8 being the result of differential sensitivity of gene induction rather than the result of differential menadione susceptibility of the integrative strains. 4.3. Real-time quantification of the transcriptional dose-response of ABC- transporters and the PDRE upon paclitaxel stress The constructed strains SNQ2-, YOR1-, PDR5-, PDR15-lucCP+ and 3xPDRE were submitted to a scale of different paclitaxel concentrations in liquid SD media at pH 3. The dynamics of the dose- response behaviour of the genes SNQ2, YOR1, PDR5, PDR15 and the PDRE was inferred by the quantification of the luciferase activity by means of the registration of light signal emission by yeast a b c 0 100 200 300 400 500 600 1 9 17 25 33 41 49 57 65 73 81 89 97 Relativeluminescenceunits Time (min) SNQ2-lucCP+ + paclitaxel 0 µM 1 µM 5 µM 10 µM 20 µM 50 µM 100 µM 200 µM a 0 5 10 15 20 25 1 9 17 25 33 41 49 57 65 73 81 89 97 Relativeluminescenceunits Time (min) YOR1-lucCP+ + paclitaxel 0 µM 1 µM 5 µM 10 µM 20 µM 50 µM 100 µM 200 µM b
- 31. 19 Figure 10. Dose-response behaviour of various ABC-transporter genes and the PDRE upon paclitaxel exposure Relative luminescence units recorded as a function of time using paclitaxel as a stress factor. The experiments were performed in triplicates. As the standard deviation was lower than the 10% for each replicate, the error bars are not shown to reduce the point density and facilitate visualisation of the figures. a) Response of SNQ2-lucCP+ strain; b) response of YOR1-lucCP+ strain; c) response of PDR5-lucCP+ strain; d) response of PDR15-lucCP+ strain and e) response of 3xPDRE strain. cells in a luminometer. Results of this assay are shown in Figure 10. No induction was registered for any strain, suggesting that no tested gene is able to have its expression triggered by paclitaxel since the luminescence response registered when yeast was exposed to the drug does not have significant differences with the response registered with the negative control (DMSO). 4.4. Real-time quantification of transcriptional dose-response of ABC-transporter genes and the PDRE upon cyclosporine A stress The constructed strains SNQ2-, YOR1-, PDR5-, PDR15-lucCP+ and 3xPDRE were submitted to a scale of different cyclosporine A concentrations in liquid SD media at pH 3. The dynamics of the dose- response behaviour of the genes SNQ2, YOR1, PDR5, PDR15 and the PDRE was inferred by the quantification of the luciferase activity by means of the registration of light signal emission by yeast 0 50 100 150 200 250 300 1 9 17 25 33 41 49 57 65 73 81 89 97 Relativeluminescenceunits Time (min) PDR5-lucCP+ + paclitaxel 0 µM 1uM 5 µM 10 µM 20 µM 50 µM 100 µM 200 µM c 0 50 100 150 200 250 300 350 400 450 1 9 17 25 33 41 49 57 65 73 81 89 97 Relativeluminescenceunits Time (min) PDR15-lucCP+ + paclitaxel 0 µM 1 µM 5 µM 10 µM 20 µM 50 µM 100 µM 200 µM d 0 200 400 600 800 1000 1200 1 9 17 25 33 41 49 57 65 73 81 89 97 Relativeluminescenceunits Time (min) 3xPDRE + paclitaxel 0 µM 1 µM 5 µM 10 µM 20 µM 50 µM 100 µM 200 µM e
- 32. 20 a b c d 0 500 1000 1500 2000 2500 3000 3500 4000 4500 5000 1 9 17 25 33 41 49 57 65 73 81 89 97 Relativeluminescenceunits Time (min) 3xPDRE + cyclosporine A 0 µM 1 µM 5 µM 10 µM 20 µM 50 µM 100 µM 200 µM 100 µM menadione e 0 5 10 15 20 25 30 35 40 45 50 1 9 17 25 33 41 49 57 65 73 81 89 97 Relativeluminescenceunits Time (min) YOR1-lucCP+ + cyclosporine A 0 µM 1 µM 5 µM 10 µM 20 µM 50 µM 100 µM 200 µM 100 µM menadione 0 500 1000 1500 2000 2500 3000 3500 4000 1 9 17 25 33 41 49 57 65 73 81 89 97 Relativeluminescenceunits Time (min) SNQ2-lucCP+ + cyclosporine A 0 µM 1 µM 5 µM 10 µM 20 µM 50 µM 100 µM 200 µM 100 µM menadione 0 1000 2000 3000 4000 5000 6000 1 9 17 25 33 41 49 57 65 73 81 89 97 Relativeluminescenceunits Time (min) PDR5-lucCP+ + cyclosporine A 0 µM 1 µM 5 µM 10 µM 20 µM 50 µM 100 µM 200 µM 100 µM menadione 0 100 200 300 400 500 600 700 800 900 1000 1 9 17 25 33 41 49 57 65 73 81 89 97 Relativeluminescenceunits Time (min) PDR15-lucCP+ + cyclosporine A 0 µM 1 µM 5 µM 10 µM 20 µM 50 µM 100 µM 200 µM 100 µM menadione
- 33. 21 Figure 11. Dose-response behaviour of various ABC-transporter genes and PDRE upon cyclosporine A stress Relative luminescence units recorded as a function of time using cyclosporine A as a stress factor. The experiments were performed in triplicates. The standard deviation was lower than the 10% for each replicate, so error bars are not shown to reduce the point density and facilitate visualisation of the figures. a) Response of SNQ2-lucCP+ strain; b) response of YOR1-lucCP+ strain; c) response of PDR5-lucCP+ strain; d) response of PDR15-lucCP+ strain; e) response of 3xPDRE strain. cells. As it can be seen, no induction was registered by stressing yeast cells with cyclosporine A (Figure 11). An extra well was added to compare the induction by cyclosporine A with the induction by 100 µM menadione as a positive control, and verify that cells are at least able to respond to a control treatment and discard experimental errors due to an inefficient handling of yeast cultures in case that no induction was registered. In this instance, for all strains (except YOR1-lucCP+ , which showed no induction for menadione throughout this thesis) a significant increase of luminescence in the cultures submitted to menadione stress could be appreciated compared to that of the negative control treatment at some moment of the experiment, that is, the curve of the menadione treatment reached higher luminescence values than that of the DMSO treatment. PDR15-lucCP+ (Figure 11d) strain had an increase in light signal at the beginning of the experiment but it was not a consequence of a specific transcriptional activation in response to the drug since the negative control (with DMSO) showed the same increase. This result suggests that cyclosporine A might not promote the transcriptional activation of the genes studied in the conditions employed in this experiment. 4.5. Real-time quantification of the transcriptional dose-response of ABC- transporter genes and the PDRE upon doxorubicin stress The constructed strains SNQ2-, YOR1-, PDR5-, PDR15-lucCP+ and 3xPDRE were submitted to a scale of different doxorubicin concentrations in liquid SD media at pH 3. The dynamics of the dose- response behaviour of the genes SNQ2, YOR1, PDR5, PDR15 and the PDRE was inferred by the quantification of the luciferase activity by means of the registration of light signal emission by yeast cells. This had a similar result than the previous one (Figure 12). Whereas no significant induction was registered for stress conditions with doxorubicin, 100 µM of menadione could trigger an increase in light signal with respect to the negative control. Therefore, doxorubicin is not able to promote transcriptional activation of the genes studied in the conditions set for this assay. 0 1000 2000 3000 4000 5000 6000 7000 1 9 17 25 33 41 49 57 65 73 81 89 97 Relativeluminescenceunits Time (min) SNQ2-lucCP+ + doxorubicin 0 µM 1 µM 5 µM 10 µM 20 µM 50 µM 100 µM 200 µM 100 µM menadione 0 5 10 15 20 25 30 35 40 45 1 9 17 25 33 41 49 57 65 73 81 89 97 Relativeluminescenceunits Time (min) YOR1-lucCP+ + doxorubicin 0 µM 1 µM 5 µM 10 µM 20 µM 50 µM 100 µM 200 µM 100 µM menadione a b
- 34. 22 Figure 12. Dose-response behaviour of various ABC-transporter genes and PDRE upon doxorubicin stress Relative luminescence units recorded as a function of time using doxorubicin as a stress factor. The experiments were performed in triplicates. The standard deviation was lower than the 10% for each replicate, so error bars are not shown to reduce the point density and facilitate visualisation of the figures. a) Response of SNQ2-lucCP+ strain; b) response of YOR1-lucCP+ strain; c) response of PDR5-lucCP+ strain; d) response of PDR15-lucCP+ strain; e) response of 3xPDRE strain. 4.6. Real-time quantification of the transcriptional dose-response of ABC- transporter genes and the PDRE upon rapamycin stress After incubation of the integrative and plasmidic strains with rapamycin, no induction was detected since luminescence in the different strains does not significantly differ from the negative control, whereas the positive control promotes light signal emission by yeast cells, except in the case 0 500 1000 1500 2000 2500 3000 3500 4000 1 9 17 25 33 41 49 57 65 73 81 89 97 Relativeluminescenceunits Time (min) PDR5-lucCP+ + doxorubicin 0 µM 1 µM 5 µM 10 µM 20 µM 50 µM 100 µM 200 µM 100 µM menadione c 0 50 100 150 200 250 300 350 400 450 500 1 9 17 25 33 41 49 57 65 73 81 89 97Relativeluminescenceunits Time (min) PDR15-lucCP+ + doxorubicin 0 µM 1 µM 5 µM 10 µM 20 µM 50 µM 100 µM 200 µM 100 µM menadione d 0 1000 2000 3000 4000 5000 6000 1 9 17 25 33 41 49 57 65 73 81 89 97 Relativeluminescenceunits Time (min) 3xPDRE + doxorubicin 0 µM 1 µM 5 µM 10 µM 20 µM 50 µM 100 µM 200 µM 100 µM menadione e
- 35. 23 of YOR1-lucCP+ (Figure 13). Therefore, rapamycin might not stimulate the expression of the ABC- transporter genes or the PDRE under the experimental conditions applied here. 4.7. pH dependence of yeast growth inhibition by various drug treatments As the luminescence assays were performed at pH 3, a drop test to compare the growth dynamics of a control strain (wild type BY4741) in the presence of the drugs used in this thesis for different pHs was carried out. pH was in the first place set at 3 was because it was reported that that condition was the most appropriate one to allow luciferin penetration inside yeast cells to be able to promote the enzymatic reaction which yields light. Nevertheless, the inability of the strains tested to undergo light emission upon gene activation as a result of drug efflux transporters transcription may be due to the fact that at pH 3, it is impossible for the tested compounds to enter the cell. Therefore, drop tests evaluating the ability of the strain BY4741 to form colonies in a medium with drugs were 0 5 10 15 20 25 30 35 40 45 1 9 17 25 33 41 49 57 65 73 81 89 97 Relativeluminescenceunits Time (min) YOR1-lucCP+ + rapamycin 0 µM 1 µM 5 µM 10 µM 20 µM 50 µM 100 µM 200 µM 100 µM menadione 0 500 1000 1500 2000 2500 3000 1 9 17 25 33 41 49 57 65 73 81 89 97 Relativeluinescenceunits Time (min) SNQ2-lucCP+ + rapamycin 0 µM 1 µM 5 µM 10 µM 20 µM 50 µM 100 µM 200 µM 100 µM menadione a b c 0 50 100 150 200 250 300 350 1 9 17 25 33 41 49 57 65 73 81 89 97 Relativeluminescenceunits Time (min) PDR15-lucCP+ + rapamycin 0 µM 1 µM 5 µM 10 µM 20 µM 50 µM 100 µM 200 µM 100 µM menadione d 0 500 1000 1500 2000 2500 3000 3500 1 9 17 25 33 41 49 57 65 73 81 89 97 Relativeluminescenceunits Time (min) PDR5-lucCP+ + rapamycin 0 µM 1 µM 5 µM 10 µM 20 µM 50 µM 100 µM 200 µM 100 µM menadione
- 36. 24 Figure 13. Dose-response behaviour of various ABC-transporter genes and PDRE upon rapamycin stress Relative luminescence units recorded as a function of time using rapamycin as a stress factor. The experiments were performed in triplicates. The standard deviation was lower than the 10% for each replicate, so error bars are not shown to reduce the point density and facilitate visualisation of the figures. a) Response of SNQ2-lucCP+ strain; b) response of YOR1-lucCP+ strain; c) response of PDR5-lucCP+ strain; d) response of PDR15-lucCP+ strain; e) response of 3xPDRE strain. performed at pH 3 and 7 (Figure 14). The drug rapamycin was not employed in this experiment because in previous drop tests it was reported, both at pH 3 and 7, to have a strong growth inhibition effect, not only affecting the cells which were embedded in the colonies having a medium with rapamycin, but also cells of adjacent colonies, interfering with the results interpretation (figures not available). This may indicate that rapamycin is able to enter the cell and have a detrimental effect but, nonetheless, that compound cannot promote the induction of any gene tested in this thesis under the employed conditions. In this assay, the biggest difference in growth comparing pH 3 to pH 7 could be observed between 1 and 3 hours after incubation with the drugs. The detrimental effect exerted by menadione became plain to see at a concentration of 200 µM, both at pH 3 and 7. For pH 7, this growth inhibition intensifies, becoming clear at concentrations of 100 µM even only one hour after incubation. This may suggest that menadione is able to penetrate yeast cells more efficiently when the pH of the medium tends to alkalinity. Besides, doxorubicin also possesses certain growth inhibition effect at 100 and 200 µM, 1 hour after incubation at pH 7, mostly when compared to the same concentration and time at pH 3. Therefore, its capability to enter the cell may be increased at alkaline pHs. Cyclosporine A also has an effect in growth that can be seen 1 hour after incubation at pH 7 if it is compared to the yeast drop at pH 3 for any concentration. On the contrary, a difference in yeast growth cannot be clearly observed for paclitaxel, possibly meaning that this drug cannot even pass through the cell membrane. With this novel data, a final set of luminescence quantification assays were performed for menadione, doxorubicin and cyclosporine A at pH 3, 5 and 7 to test the sensitivity and induction of the strains to these new conditions. The strains selected for the assays were SNQ2-lucCP+ , because it showed the best induction and sensitivity dynamics for menadione, and 3xPDRE, since it was a plasmidic strain and its response to drugs was interesting to analyse as the luciferase reporter was controlled by a promoter that contained sites for the specific binding to PDR transcription factors (PDRE sites) that 0 1000 2000 3000 4000 5000 6000 1 9 17 25 33 41 49 57 65 73 81 89 97 Relativeluminescenceunits Time (min) 3xPDRE + rapamycin 0 µM 1 µM 5 µM 10 µM 20 µM 50 µM 100 µM 200 µM 100 µM menadione e c
- 37. 25 can activate several MDR genes and that are activated only by xenobiotics, not like SNQ2, which can be activated by other stimulus. Figure 14. Drug sensitivity assays performed with a wild type yeast strain at different pH Drop tests with BY4741 in SD medium at pH 3 and 7 incubated at 28 ºC on YPD Petri dishes. a) Photo of pH 3 culture taken 1 hour after incubation; b) photo of pH 3 culture taken 3 hours after incubation; c) photo of pH 3 culture taken 22 hours after incubation; d) photo of pH 7 culture taken 1 hour after incubation; e) photo of pH 7 culture taken 3 hours after incubation and f) photo of pH 7 culture taken 22 hours after incubation. f b a d e c pH 3 pH 7
- 38. 26 4.8. Real-time quantification of the transcriptional dose-response of SNQ2-lucCP+ upon menadione stress at different pHs SNQ2-lucCP+ was submitted to a scale of different menadione concentrations in liquid SD media at pH 3, 5 and 7. A comparative analysis at those pHs of the dose-response dynamics of the gene SNQ2 was performed by the quantification of the luciferase activity by means of the registration of light signal emission by yeast cells. A subsequent increase in luminescence in SNQ2-lucCP+ strains by menadione was reported at pH 3, 5 and 7 (Figure 15). In the fold-induction figure (Figure 15d), it is noticeable that the sensitivity of yeast cells to menadione increases along with pH, since the light signal increases at a higher rate for the same menadione concentrations. Nevertheless, with the data gathered, it is not possible to clearly state any difference in menadione sensitivity for pH 5 and 7, whereas it is safe to consider that cells grown at pH 5 and 7 have a greater sensitivity to menadione than those grown at pH 3 for the gene SNQ2. Moreover, as pH reaches alkalinity, cells are able to take up less luciferin, thus resulting in a less absolute luminescence emission. That is the reason why the fold-induction curve at pH 7 reaches its maximum light emission at a menadione concentration lower than the rest (100 µM), explaining also why relative luminescence values are higher at pH3 (Figure 15a) than at pH 5 (Figure 15b) and pH 7 (Figure 15c). These results are consistent with the drop test given that they explain why yeast cultures had a higher growth inhibition for menadione at pH 7 than at pH 3: as cells become more sensitive to this drug, the detrimental effect is more evident. 4.9. Real-time quantification of the dose-response of PDRE driven gene expression upon menadione stress at different pHs 3xPDRE strain was submitted to a scale of different menadione concentrations in liquid SD media at pH 3, 5 and 7. A comparative analysis at those pHs of the dose-response dynamics of the PDRE driven gene expression was performed by the quantification of the luciferase activity by means of the registration of light signal emission by yeast cells. The results obtained for this plasmidic strain are similar to the previous ones (Figure 16), but with the exception that the reduction in luciferin uptake at pH 7 was here more evident because luciferase expression was under the control of an artificial promotor, possibly resulting in the loss of its natural transcriptional activation capability 0 20 40 60 80 100 120 140 160 180 200 1 9 17 25 33 41 49 57 65 73 81 89 97 Relativeluminescenceunits Time (min) SNQ2-lucCP+ pH 5 + menadione 0 µM 10 µM 20 µM 50 µM 75 µM 100 µM 150 µM 200 µM 0 500 1000 1500 2000 2500 3000 3500 4000 4500 1 9 17 25 33 41 49 57 65 73 81 89 97 Relativeluinescenceunits Time (min) SNQ2-lucCP+ pH 3 + menadione 0 µM 10 µM 20 µM 50 µM 75 µM 100 µM 150 µM 200 µM a b
- 39. 27 Figure 15. pH dependence of the SNQ2 dose-response upon menadione exposure Relative luminescence units recorded as a function of time using menadione as a stress factor in SNQ2-lucCP+ strains at different pHs and the corresponding fold-induction curve. The experiments were performed in triplicates. The standard deviation was lower than the 10% for each replicate, so error bars are not shown to reduce the point density and facilitate visualisation of the figures (figures 15a, 15b and 15c). a) pH set at 3; b) pH set at 5; c) pH set at 7 and d) fold-induction curve comparing all pHs. (Figure 16c). Therefore, the fold-induction curve was only constructed for assays at pH 3 and 5 (Figure 16d). Cells cultured at pH 5 showed a bigger sensitivity for menadione than the ones grown at pH 3, being consistent with the results from the drop test. In addition, for both pHs, cells reach their maximum luminescence emission peak at a concentration lower than the SNQ2-lucCP+ . This result was also observed in the first round of luminescence assays at pH 3, when SNQ2-lucCP+ showed the best induction dynamics. The explanations to this phenomenon are yet to be unravelled. 0 50 100 150 200 250 1 9 17 25 33 41 49 57 65 73 81 89 97 Relativeluminescenceunits Time (min) 3xPDRE pH 5 + menadione 0 µM 10 µM 20 µM 50 µM 75 µM 100 µM 150 µM 200 µM 0 20 40 60 80 100 120 140 0 50 100 150 200 Adjusted,corrected,maximum luminescenceunits Menadione concentration (µM) Fold-induction SNQ2-lucCP+ + menadione SNQ2 pH3 SNQ2 pH5 SNQ2 pH7 0 10 20 30 40 50 60 70 1 9 17 25 33 41 49 57 65 73 81 89 97 Relativeluminescenceunits Time (min) SNQ2-lucCP+ pH 7 + menadione 0 µM 10 µM 20 µM 50 µM 75 µM 100 µM 150 µM 200 µM dc a b 0 500 1000 1500 2000 2500 1 9 17 25 33 41 49 57 65 73 81 89 97 Relativeluminescenceunits Time (min) 3xPDRE pH 3 + menadione 0 µM 10 µM 20 µM 50 µM 75 µM 100 µM 150 µM 200 µM
- 40. 28 Figure 16. pH dependence of the PDRE-driven gene expression upon menadione exposure Relative luminescence units recorded as a function of time using menadione as a stress factor in 3xPDRE strains at different pHs and the corresponding fold-induction curve. The experiments were performed in triplicates. The standard deviation was lower than the 10% for each replicate, so error bars are not shown to reduce the point density and facilitate visualisation of the figures (figures 16a, 16b and 16c). a) pH set at 3; b) pH set at 5; c) pH set at 7 and d) fold-induction curve comparing all pHs. 4.10. Real-time quantification of the dose-response of SNQ2-lucCP+ upon doxorubicin stress at different pHs SNQ2-lucCP+ was submitted to a scale of different doxorubicin concentrations in liquid SD media at pH 3, 5 and 7. A comparative analysis at those pHs of the dose-response dynamics of the gene SNQ2 was performed by the quantification of the luciferase activity by means of the registration of light signal emission by yeast cells. No gene induction was recorded for any pH in this experiment (Figure 17). Therefore, even though doxorubicin in a pH 7 medium can enter the cell and have 0 10 20 30 40 50 60 70 1 9 17 25 33 41 49 57 65 73 81 89 97 Relativeluminescenceunits Time (min) SNQ2-lucCP+ pH 5 + doxorubicin 0 µM 10 µM 20 µM 50 µM 75 µM 100 µM 150 µM 200 µM 0 20 40 60 80 100 120 0 50 100 150 200 Adjusted,corrected,maximum luminescenceunits Menadione concentration (µM) Fold-induction 3xPDRE + menadione 3xPDRE pH 3 3xPDRE pH 5 0 100 200 300 400 500 600 700 1 9 17 25 33 41 49 57 65 73 81 89 97 Relativeluminescenceunits Time (min) SNQ2-lucCP+ pH 3 + doxorubicin 0 µM 10 µM 20 µM 50 µM 75 µM 100 µM 150 µM 200 µM a b 0 10 20 30 40 50 60 70 1 9 17 25 33 41 49 57 65 73 81 89 97 Relativeluminescenceunits Time (min) 3xPDRE pH 7 + menadione 0 µM 10 µM 20 µM 50 µM 75 µM 100 µM 150 µM 200 µM c d
- 41. 29 Figure 17. Dose-response profiles of SNQ2 upon doxorubicin stress at different pHs Relative luminescence units recorded as a function of time using doxorubicin as a stress factor in SNQ2-lucCP+ strains at different pHs. The experiments were performed in triplicates. The standard deviation was lower than the 10% for each replicate, so error bars are not shown to reduce the point density and facilitate visualisation of the figures. a) pH set at 3; b) pH set at 5 and c) pH set at 7 detrimental effects in yeast growth, as it was confirmed by the drop test, no light signal was perceived tending to alkalinity (Figure 17b and 17c). That may indicate that despite the fact that doxorubicin has a biological effect in yeast, no SNQ2 induction is triggered as a defensive mechanism. 4.11. Real-time quantification of the dose-response of the PDRE upon doxorubicin stress at different pHs 3xPDRE was submitted to a scale of different doxorubicin concentrations in liquid SD media at pH 3, 5 and 7 (Figure 18). A comparative analysis at those pHs of the dose-response dynamics of c 0 5 10 15 20 25 30 35 40 45 1 9 17 25 33 41 49 57 65 73 81 89 97 Relativeluminescenceunits Time (min) SNQ2-lucCP+ pH 7 + doxorubicin 0 µM 10 µM 20 µM 50 µM 75 µM 100 µM 150 µM 200 µM 0 100 200 300 400 500 600 700 800 900 1000 1 9 17 25 33 41 49 57 65 73 81 89 97 Relativeluminescenceunits Time (min) 3xPDRE pH 3 + doxorubicin 0 µM 10 µM 20 µM 50 µM 75 µM 100 µM 150 µM 200 µM 0 20 40 60 80 100 120 140 160 1 9 17 25 33 41 49 57 65 73 81 89 97 Relativeluminescenceunits Time (min) 3xPDRE pH 5 + doxorubicin 0 µM 10 µM 20 µM 50 µM 75 µM 100 µM 150 µM 200 µM ba
- 42. 30 Figure 18. Dose response profiles of PDRE-driven gene expression upon doxorubicin stress at different pHs Relative luminescence units recorded as a function of time using doxorubicin as a stress factor in 3xPDRE strains at different pHs. The experiments were performed in triplicates. The standard deviation was lower than the 10% for each replicate, so error bars are not shown to reduce the point density and facilitate visualisation of the figures. a) pH set at 3; b) pH set at 5 and c) pH set at 7. the PDRE driven gene expression was performed by the quantification of the luciferase activity by means of the registration of light signal emission by yeast cells. This experiment yielded identical results than the previous one. No light emission significantly greater than the negative control was recorded, therefore meaning that there was no significant gene induction. Even though doxorubicin enters yeast cells and interferes with colonies’ growth, cells do not respond to that stress by means of a transcriptional activation of PDRE. 4.12. Real-time quantification of the dose-response of in SNQ2-lucCP+ upon stress with cyclosporine A at different pHs SNQ2-lucCP+ was submitted to a scale of different cyclosporine A concentrations in liquid SD media at pH 3, 5 and 7. A comparative analysis at those pHs of the dose-response dynamics of the gene SNQ2 was performed by the quantification of the luciferase activity by means of the registration of light signal emission by yeast cells. No light signal for any pH stronger than the negative control was detected in this assay (Figure 19). Therefore, the analysis is similar: despite having a biological effect in yeast cells, cyclosporine A cannot induce the expression of SNQ2. 4.13. Real-time quantification of the dose-response of the PDRE upon cyclosporine A stress at different pHs 3xPDRE+ was submitted to a scale of different cyclosporine A concentrations in liquid SD media at pH 3, 5 and 7. A comparative analysis at those pHs of the dose-response dynamics of the PDRE driven gene expression was performed by the quantification of the luciferase activity by means of the registration of light signal emission by yeast cells. No light emission was registered for 3xPDRE neither (Figure 20). Cyclosporine A, then, was not able to promote a transcriptional activation of PDRE as a 0 10 20 30 40 50 60 70 1 9 17 25 33 41 49 57 65 73 81 89 97 Relativeluminescenceunits Time (min) 3xPDRE pH 7 + doxorubicin 0 µM 10 µM 20 µM 50 µM 75 µM 100 µM 150 µM 200 µM c
- 43. 31 Figure 19. Dose-response profiles of the SNQ2 gene upon cyclosporine A stress at different pHs Relative luminescence units recorded as a function of time using cyclosporine A as a stress factor in SNQ2-lucCP+ strains at different pHs. The experiments were performed in triplicates. The standard deviation was lower than the 10% for each replicate, so error bars are not shown to reduce the point density and facilitate visualisation of the figures. a) pH set at 3; b) pH set at 5 and c) pH set at 7. defensive response, despite the biological effect which this drug had in yeast cells. 0 5 10 15 20 25 30 35 40 1 9 17 25 33 41 49 57 65 73 81 89 97 Relativeluminescenceunits Time (min) SNQ2-lucCP+ pH 7 + cyclosporine A 0 µM 10 µM 20 µM 50 µM 75 µM 100 µM 150 µM 200 µM 0 100 200 300 400 500 600 700 800 1 9 17 25 33 41 49 57 65 73 81 89 97 Relativeluminescenceunits Time (min) SNQ2-lucCP+ pH 3 + cyclosporine A 0 µM 10 µM 20 µM 50 µM 75 µM 100 µM 150 µM 200 µM 0 10 20 30 40 50 60 70 80 90 1 9 17 25 33 41 49 57 65 73 81 89 97 Relativeluminescenceunits Time (min) SNQ2-lucCP+ pH 5 + cyclosporine A 0 µM 10 µM 20 µM 50 µM 75 µM 100 µM 150 µM 200 µM c a b
- 44. 32 Figure 20. Dose-response profiles of PDRE-driven gene expression upon cyclosporine A stress at different pHs Relative luminescence units recorded as a function of time using cyclosporine A as a stress factor in 3xPDRE strains at different pHs. The experiments were performed in triplicates. The standard deviation was lower than the 10% for each replicate, so error bars are not shown to reduce the point density and facilitate visualisation of the figures. a) pH set at 3; b) pH set at 5 and c) pH set at 7. 4.14. Final assessment about the discussion of the results obtained in the thesis To conclude, from all the relevant information extracted from the data, it is possible to state that SNQ2, PDR5, PDR15 and the PDRE driven gene expression are activated upon menadione exposure, having SNQ2 the highest sensitivity and induction. YOR1 was never induced all throughout this thesis. In other experiments conducted in this laboratory, it was shown that YOR1 can respond to mycotoxin treatments and, as it seems, it may not be specific of the oxidative stress produced by menadione. More research is needed to fully understand the comparative activation dynamics of these genes. 0 20 40 60 80 100 120 140 160 180 200 1 9 17 25 33 41 49 57 65 73 81 89 97 Relativeluminescenceunits Time (min) 3xPDRE pH 5 + cyclosporine A 0 µM 10 µM 20 µM 50 µM 75 µM 100 µM 150 µM 200 µM 0 10 20 30 40 50 60 1 9 17 25 33 41 49 57 65 73 81 89 97 Relativeluminescenceunits Time (min) 3xPDRE pH 7 + cyclosporine A 0 µM 10 µM 20 µM 50 µM 75 µM 100 µM 150 µM 200 µM c 0 200 400 600 800 1000 1200 1400 1600 1800 2000 1 9 17 25 33 41 49 57 65 73 81 89 97 Relativeluminescenceunits Time (min) 3xPDRE pH 3 + cyclosporine A 0 µM 10 µM 20 µM 50 µM 75 µM 100 µM 150 µM 200 µM a b
- 45. 33 Besides, paclitaxel, cyclosporine A, doxorubicin and rapamycin cannot induce the studied genes at pH 3. At pH 7, cyclosporine A and doxorubicin can significantly interfere with yeast colonies’ growth when compared to pH 3. Rapamycin has a strong antifungal activity both at pH 3 and 7, but as it could not promote transcriptional activation at pH 3, it is likely that it cannot promote MDR by means of the tested genes under the studied conditions. Paclitaxel did not have a clear effect in yeast survival. pH 5 and 7 could trigger a higher sensitivity and induction of SNQ2 to menadione. Therefore, it is possible that at pH 3 menadione has a limited capability to enter yeast cells, increasing when pH tends to alkalinity, explaining why in the drop test it was shown that menadione had a higher detrimental effect in yeast at pH 7. The PDRE was also more sensitive to menadione at pH 5 than at pH 3. Nevertheless, it had a smaller induction capability with respect to SNQ2, being almost unnoticeable at pH 7. From all the possible explanations, it is likely to consider that luciferase expression in 3xPDRE strain was decreased by the fact of being under the control of an artificial promoter, having a decreased potential to be induced by xenobiotics, as well as the fact that yeast cells permeability to luciferin decreases with alkaline pHs. Furthermore, doxorubicin and cyclosporine A could not promote the induction of SNQ2 and the PDRE. Therefore, even though they cause a biological effect in yeast cells, they cannot trigger a defensive mechanism that involves the overexpression of the drug efflux pump Snq2p and the overexpression of the PDRE that can activate other drug efflux pumps. Finally, it is possible that doxorubicin, cyclosporine A, rapamycin and paclitaxel cannot induce the activation of MDR in yeast due to their big size. The evolutionary role of drug efflux pumps in yeast is mainly related to defence against mycotoxins produced by other fungi. Mycotoxins are generally molecules of small size, so drug efflux pumps in yeast may have evolved to be transcriptionally activated and aim at different small molecules related to mycotoxins. That would explain why menadione, a strong oxidant of small size, can promote the induction of ABC genes belonging to a MDR response, whereas the big-sized, medicine-oriented molecules tested in this thesis could not promote the induction of SNQ2, PDR5, PDR15, YOR1 and PDRE-driven gene expression.
- 46. 5. Conclusions
- 47. 34 5. Conclusions In a general view, after the research conducted in this thesis, it has been deduced that: The expression of yeast ABC-transporter genes SNQ2, PDR5, PDR15 and YOR1 shows different sensitivities to menadione, with SNQ2 and PDR5 being the most sensitive ones, PDR15 less sensitive and YOR1 not responding whatsoever. The PDRE is activated by menadione with comparable sensitivity to SNQ2 or PDR5. Growth inhibition of yeast cells by menadione, doxorubicin and cyclosporine A is enhanced at higher pH. Accordingly, the dose-response of the SNQ2 gene or PDRE-driven gene expression is shifted to lower concentrations in the case of menadione exposure. Doxorubicin and cyclosporine A, however, do not induce SNQ2 or the PDRE despite having inhibitory effect on yeast growth. Paclitaxel does not significantly inhibit yeast growth and has no stimulatory effect on the tested ABC-transporter gene expression.
- 48. 6. References
- 49. 35 6. References ALI, A.; NANDAGOPAL, N.; LEE, S. (2015). IL-15–PI3K–AKT–mTOR: A Critical Pathway in the Life Journey of Natural Killer Cells. Front. Immunol., 6. ARRIOLA APELO; S.I. AND LAMMING, D.W. (2016). Rapamycin: An InhibiTOR of Aging Emerges From the Soil of Easter Island. The journals of gerontology. Series A, Biological sciences and medical sciences., pii: glw090. BAGULEY, B. (2010). Multiple Drug Resistance Mechanisms in Cancer. Molecular Biotechnology, 46(3), pp.308-316. BECK, R.; VERRAX, J.; DEJEANS, N.; TAPER, H.; CALDERON, P. (2009). Menadione Reduction by Pharmacological Doses of Ascorbate Induces an Oxidative Stress That Kills Breast Cancer Cells. International Journal of Toxicology, 28(1), pp.33-42. BINKHATHLAN, Z.; LAVASANIFAR, A. (2013). P-glycoprotein Inhibition as a Therapeutic Approach for Overcoming Multidrug Resistance in Cancer: Current Status and Future Perspectives. Current Cancer Drug Targets, 13(3), pp.326-346. CASTRO, F.; MARIANI, D.; PANEK, A.; ELEUTHERIO, E.; PEREIRA, M. (2008). Cytotoxicity Mechanism of Two Naphthoquinones (Menadione and Plumbagin) in Saccharomyces cerevisiae. PLoS ONE, 3(12), p.e3999. CHEMICALBOOK. (2016). Paclitaxel | 33069-62-4, viewed on May 22nd , 2016, available at: http://www.chemicalbook.com/ChemicalProductProperty_EN_CB3273425.htm CHEN, K.; MIYAZAKI, T.; TSAI, H.; BENNETT, J. (2007). The bZip transcription factor Cgap1p is involved in multidrug resistance and required for activation of multidrug transporter gene CgFLR1 in Candida glabrata. Gene, 386(1-2), pp.63-72. CHEN, Z.; SHI, T.; ZHANG, L.; ZHU, P.; DENG, M.; HUANG, C.; HU, T.; JIANG, L.; LI, J. (2016). Mammalian drug efflux transporters of the ATP binding cassette (ABC) family in multidrug resistance: A review of the past decade. Cancer Letters, 370(1), pp.153-164. CHIOU, T.; ZHANG, J.; FERRANS, V.; TZENG, W. (1997). Cardiac and renal toxicity of menadione in rat. Toxicology, 124(3), pp.193-202. CORMACK, B. (1998). Green fluorescent protein as a reporter of transcription and protein localization in fungi. Current Opinion in Microbiology, 1(4), pp.406-410. CUI, Z.; SHIRAKI, T.; HIRATA, D.; MIYAKAWA, T. (1998). Yeast gene YRR1, which is required for resistance to 4-nitroquinoline N-oxide, mediates transcriptional activation of the multidrug resistance transporter gene SNQ2. Molecular Microbiology, 29(5), pp.1307-1315. DANESI, R.; FOGLI, S.; GENNARI, A.; CONTE, P.; DEL TACCA, M. (2002). Pharmacokinetic- Pharmacodynamic Relationships of the Anthracycline Anticancer Drugs. Clinical Pharmacokinetics, 41(6), pp.431-444. DEAN, M. (2001). The Human ATP-Binding Cassette (ABC) Transporter Superfamily. Genome Research, 11(7), pp.1156-1166.