Mais conteúdo relacionado
Semelhante a JLL Grand Rapids Industrial Insight - Fall 2016 (20)
JLL Grand Rapids Industrial Insight - Fall 2016
- 1. Grand Rapids top manufacturing employers
Source: The Right Place
Industrial employment (12-month change, 000s)
Source: U.S. Bureau of Labor Statistics
Industrial construction pipeline
Source: JLL Research
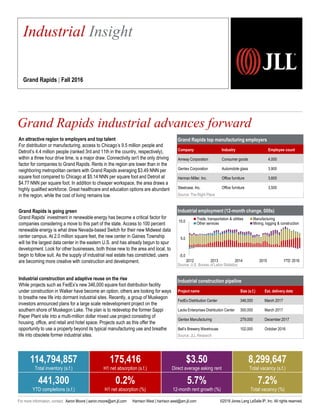
Grand Rapids industrial advances forward
2,257
Industrial Insight
Grand Rapids | Fall 2016
©2016 Jones Lang LaSalle IP, Inc. All rights reserved.For more information, contact: Aaron Moore | aaron.moore@am.jll.com Harrison West | harrison.west@am.jll.com
114,794,857
Total inventory (s.f.)
175,416
H1 net absorption (s.f.)
$3.50
Direct average asking rent
8,299,647
Total vacancy (s.f.)
441,300
YTD completions (s.f.)
0.2%
H1 net absorption (%)
5.7%
12-month rent growth (%)
7.2%
Total vacancy (%)
Company Industry Employee count
Amway Corporation Consumer goods 4,000
Gentex Corporation Automobile glass 3,900
Herman Miller, Inc. Office furniture 3,600
Steelcase. Inc. Office furniture 3,500
An attractive region to employers and top talent
For distribution or manufacturing, access to Chicago’s 9.5 million people and
Detroit’s 4.4 million people (ranked 3rd and 11th in the country, respectively),
within a three hour drive time, is a major draw. Connectivity isn't the only driving
factor for companies to Grand Rapids. Rents in the region are lower than in the
neighboring metropolitan centers with Grand Rapids averaging $3.49 NNN per
square foot compared to Chicago at $5.14 NNN per square foot and Detroit at
$4.77 NNN per square foot. In addition to cheaper workspace, the area draws a
highly qualified workforce. Great healthcare and education options are abundant
in the region, while the cost of living remains low.
Grand Rapids is going green
Grand Rapids’ investment in renewable energy has become a critical factor for
companies considering a move to this part of the state. Access to 100 percent
renewable energy is what drew Nevada-based Switch for their new Midwest data
center campus. At 2.0 million square feet, the new center in Gaines Township
will be the largest data center in the eastern U.S. and has already begun to spur
development. Look for other businesses, both those new to the area and local, to
begin to follow suit. As the supply of industrial real estate has constricted, users
are becoming more creative with construction and development.
Industrial construction and adaptive reuse on the rise
While projects such as FedEx’s new 346,000 square foot distribution facility
under construction in Walker have become an option, others are looking for ways
to breathe new life into dormant industrial sites. Recently, a group of Muskegon
investors announced plans for a large scale redevelopment project on the
southern shore of Muskegon Lake. The plan is to redevelop the former Sappi
Paper Plant site into a multi-million dollar mixed use project consisting of
housing, office, and retail and hotel space. Projects such as this offer the
opportunity to use a property beyond its typical manufacturing use and breathe
life into obsolete former industrial sites.
-5.0
5.0
15.0
2012 2013 2014 2015 YTD 2016
Trade, transportation & utilities Manufacturing
Other services Mining, logging & construction
Project name Size (s.f.) Est. delivery date
FedEx Distribution Center 346,000 March 2017
Lacks Enterprises Distribution Center 300,000 March 2017
Gentex Manufacturing 279,000 December 2017
Bell’s Brewery Warehouse 102,000 October 2016
- 2. Construction deliveries (s.f.)
Source: JLL Research
Total vacancy rate (%)
Source: JLL Research
Direct average asking rent ($ p.s.f.)
Source: JLL Research
2,257
Industrial Fundamentals
Grand Rapids | Fall 2016
©2016 Jones Lang LaSalle IP, Inc. All rights reserved.For more information, contact: Aaron Moore | aaron.moore@am.jll.com Harrison West | harrison.west@am.jll.com
-
100,000
200,000
300,000
400,000
2007 2008 2009 2010 2011 2012 2013 2014 2015 H1 2016
Warehouse & Distribution Manufacturing Flex
$2.00
$3.75
$5.50
$7.25
$9.00
2007 2008 2009 2010 2011 2012 2013 2014 2015 H1 2016
Warehouse & Distribution Manufacturing Flex
0.0%
5.0%
10.0%
15.0%
20.0%
2007 2008 2009 2010 2011 2012 2013 2014 2015 H1 2016
Warehouse & Distribution Manufacturing Flex
- 3. 2,257
Industrial Statistics
Grand Rapids | Fall 2016
©2016 Jones Lang LaSalle IP, Inc. All rights reserved.For more information, contact: Aaron Moore | aaron.moore@am.jll.com Harrison West | harrison.west@am.jll.com
Inventory
(s.f.)
H1 2016
total net
absorption
(s.f.)
H1 2016
total net
absorption
(% of stock)
Total
vacancy
(s.f.)
Total
vacancy
(%)
Average
total asking
rent
($ p.s.f.)
YTD
completions
(s.f.)
Under
construction
(s.f.)
Grand Rapids Totals
Warehouse & Distribution 51,227,173 803,329 1.6% 3,638,366 7.1% $3.25 366,300 0
Manufacturing 63,567,684 -627,913 -1.0% 4,661,281 7.3% $3.88 75,000 0
Totals 114,794,857 175,416 0.2% 8,299,647 7.2% $3.50 441,300 0
Flex 5,311,675 571,336 10.8% 202,961 3.8% $5.62 0 0
Downtown
Warehouse & Distribution 6,267,663 145,354 2.3% 678,429 10.8% $2.98 0 0
Manufacturing 4,562,412 -20,996 -0.5% 410,590 9.0% $7.83 0 0
Totals 10,830,075 124,358 1.1% 1,089,019 10.1% $4.81 0 0
Flex 222,333 31,154 14.0% 0 0.0% $0.00 0 0
Northeast
Warehouse & Distribution 2,233,671 -23,198 -1.0% 106,982 4.8% $3.99 0 0
Manufacturing 6,647,604 -28,772 -0.4% 126,000 1.9% $3.63 0 0
Totals 8,881,275 -51,970 -0.6% 232,982 2.6% $3.80 0 0
Flex 398,057 0 0.0% 0 0.0% $0.00 0 0
Northwest
Warehouse & Distribution 6,703,253 -122,195 -1.8% 663,453 9.9% $3.37 0 0
Manufacturing 11,271,647 70,773 0.6% 565,966 5.0% $3.14 0 0
Totals 17,974,900 -51,422 -0.3% 1,229,419 6.8% $3.26 0 0
Flex 1,094,109 0 0.0% 0 0.0% $0.00 0 0
Southeast
Warehouse & Distribution 24,474,267 835,805 3.4% 1,808,437 7.4% $3.30 366,300 0
Manufacturing 20,768,004 -744,941 -3.6% 2,778,702 13.4% $4.23 75,000 0
Totals 45,242,271 90,864 0.2% 4,587,139 10.1% $3.86 441,300 0
Flex 2,855,817 540,182 18.9% 180,768 6.3% $5.69 0 0
Southwest
Warehouse & Distribution 11,574,639 -32,437 -0.3% 381,065 3.3% $3.19 0 0
Manufacturing 20,349,227 96,023 0.5% 780,023 3.8% $3.30 0 0
Totals 31,923,866 63,586 0.2% 1,161,088 3.6% $3.26 0 0
Flex 741,359 0 0.0% 22,193 3.0% $4.79 0 0