The A-to-Z of Deliverability
•
1 gostou•462 visualizações

This document discusses best practices for improving email deliverability and revenue performance management. It covers topics like lead scoring, sales enablement, marketing automation, CRM integration, data management, program architecture, acquisitions, bounce rates, conversion measurement, engagement, filters, Gmail, justification, mobile optimization, non-compliance, personalization, quarantine, re-engagement, subject lines, testing, unsubscribes, volume, and zero tolerance. The key aspects discussed are optimizing different aspects of the email program to improve deliverability and maximize open and conversion rates.

Recomendados
Recomendados
Mais conteúdo relacionado
Mais procurados
Mais procurados (20)
Semelhante a The A-to-Z of Deliverability
Semelhante a The A-to-Z of Deliverability (20)
Último
Último (20)
The A-to-Z of Deliverability
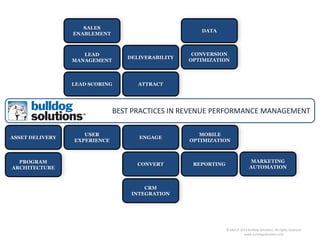
- 1. BEST PRACTICES IN REVENUE PERFORMANCE MANAGEMENT LEAD SCORING DELIVERABILITY SALES ENABLEMENT ATTRACT ENGAGE REPORTINGCONVERT CONVERSION OPTIMIZATION USER EXPERIENCE ASSET DELIVERY MOBILE OPTIMIZATION MARKETING AUTOMATION CRM INTEGRATION DATA LEAD MANAGEMENT PROGRAM ARCHITECTURE © March 2013 Bulldog Solutions. All rights reserved. www.bulldogsolutions.com
- 2. ACQUISITIONS
- 3. ACQUISITION STRATEGIES Validate List Sources – Keep in mind – when buying or renting lists, they result in a higher number of complaints and bounces. Instead, organically generate your own leads and lists. – If you do buy lists, make sure you trust the list provider regarding data quality and timeliness. Understand: • Source of data • Age and last usage date • How they monitor and remove complainers • How they verify and maintain opt-in status – Only send to email lists that have been recently compiled. – Review Eloqua’s Outside List Acquisition best common practices document – Regularly review the performance of purchased data to determine whether a source is worth your investment
- 4. BOUNCES
- 5. BOUNCES MSI campaigns maintained consistent hard bounce rates, averaging 1.5% over the course of 2012 with spikes for new audiences or audiences that are typically under- communicated with. Eloqua manages hard bounces by automatically processing those addresses and removing them from future mailings. The soft bounce rate averaged slightly higher at 4.2% but trended higher during different points in the year. Soft bounces are not automatically processed by Eloqua as a soft bounce can be transactional in nature, meaning an address can soft bounce one day and be deliverable the next. 0.00% 2.00% 4.00% 6.00% 8.00% 10.00% 12.00% 14.00% Hard Bounce Soft Bounce
- 6. CONVERSIONS
- 7. CONVERSION MEASUREMENT The measurement of email deliverability is an important marker to observe and optimize due to its demonstrated ties into digital marketing performance. In general, there are two key focal points when it comes to improving the success of any digital marketing campaign: • Get more visitors to your offer • Do more with your current visitors Deliverability, alongside traffic generation and attraction activities, is a subset of Point #1 – increasing the amount of inboxes in which your marketing campaign will land. The higher the deliverability score, the more value created from the current marketing database – without additional acquisition tactics or programs.
- 9. DATA
- 10. DATA Good email address: bill.subscriber@yahoo.com Bad email address: lrx11tg32@spamex.com
- 11. ENGAGEMENT
- 12. ENGAGEMENT
- 13. FILTERS
- 14. FILTERS Filter on Recipient Activity Segment by behaviors and target offers based on digital body language to reduce complaints and improve your reputation. – Filter contacts that have NOT opened or clicked on an email within the past 3 to 6 months. Send a separate campaign asking them to remove themselves from your list, manage their subscriptions, or tell you what you can do differently to raise their interest. – After several unsuccessful attempts to obtain opens, clicks or unsubscribes, suppress contacts from future distribution lists. – Focus on quality over quantity.
- 15. GMAIL
- 16. GMAIL defined as… Any email account that is accessed through a Web browser. The interface is implemented as a Web site that provides access to the various functions like reading, sending or organizing messages. Emails are typically not downloaded to the user's computer but stored on the Web-based email service provider's servers. Popular examples of Web-based email services include Hotmail and Yahoo Mail.
- 17. GMAIL > Challenge – Recurring/consistent bulking at Gmail – No visibility into feedback loops > Need – Prove Motorola emails should be delivered – Busy season approaching > Solution – Stop mailing inactive Gmail subscribers – Monitor inbox delivery – Slowly “loosen the reigns” > Results – 100% Gmail inbox delivery
- 18. HOW
- 19. Know Your Sender Score. – Measure and monitor it for free at http://www.senderscore.org. All scores are based on a scale of 0 to 100, where 0 is the worst and 100 is the best possible score. – According to ReturnPath the benchmark for a good sender score is 90.46. – Current Motorola Solutions Sender Score Authenticate your Email IP Address. – Publish IP-based solutions like Sender Policy – Framework (SPF) and Cryptographic solutions like Domain Keys Identified Mail (DKIM), SenderID and DMARC – Create separate records for each type of email communication, such as promotional, transactional, newsletter and corporate. HOW-TO HELP IMPROVE DELIVERABILITY
- 20. Control Complaints. – Monitor complaint trends throughout each email campaign. • Do certain types of campaigns create higher complaint rates with your audience? • Always test major changes in content, copy, creative, frequency of sending and even send timing. Testing allows you to gauge tolerance for change among your audience and react accordingly. – Avoid getting on blacklists. Monitor http://www.dnsstuff.com – For your IP addresses, use the free lookup tool at http://www.mxtoolbox.com/blacklists.aspx or see black listings via the Blacklist Monitor service from Return Path. HOW-TO HELP IMPROVE DELIVERABILITY
- 21. Gain Recipient Permission and Respect Recipient Preference – New Recipients • Only send to those who have explicitly requested email from you. • Target "neutral" contacts (i.e., those who have neither opted in nor opted out) with the goal of gaining permission. – Active Recipients • Strengthen the relationship with active opt-in contacts by soliciting feedback on the quality and frequency of your communications, and their communication preferences. Confirm preferences with the recipient and then comply. • Send only what the subscriber signed up to receive. – Inactive Recipients • Re-engage inactive contacts by confirming subscription status one or two times per year. • Nurture inactive contacts and cut inactive contacts after they fail to re-engage after a set timeframe HOW-TO HELP IMPROVE DELIVERABILITY
- 22. Perform IP Warming Before Launching Campaigns On New IPs. – Send to all addresses in a phased manner and then remove hard bounces. – Confirm the list doesn’t contain previously unsubscribed and bounced addresses. – Use recent contact information only (i.e., less than 6 months old) and consider segmenting by domain for optimum cleansing. – Use HTML with simple design, minimal images, and short copy. – Consider an introductory email for new contacts or contacts that have not been contacted very recently. – Review reports after each send to pinpoint problems before the next send. HOW-TO HELP IMPROVE DELIVERABILITY
- 23. Process Bounces – Remove hard bounces immediately. – Keep hard bounces under 3% for each campaign. – Monitor spam bounce reports and complaints over time to identify trends that help pinpoint changes in your marketing processes that may have hurt your reputation. – Regularly review soft bounces, messages provided in soft bounce reports can point to larger problems and trends HOW-TO HELP IMPROVE DELIVERABILITY Reinforce Email Expectations Clearly communicate your privacy policy and the type of content you send and when. – Send a welcome message to new email subscribers with instructions on how to ensure the emails get delivered and the benefits of subscribing. – Check in with contacts periodically to verify that they are satisfied with your content and highlight options for changing their communication preferences. – Move your subscription management options to the top of your emails so they don’t get overlooked
- 24. Optimize Relevancy and Frequency – Use automated programs to test frequency and determine the optimal mix for your target audience. – Ask subscribers for input and feedback on relevancy and frequency. HOW-TO HELP IMPROVE DELIVERABILITY Optimize Content – Make sure you are clearly communicating your message-even with images turned off. • Use preheader text and optimize for a preview pane (which typically does not display with images) • Review the content and aesthetic of the text-only version of your emails – Consider implementing responsive email design that is flexible enough to encourage mobile email readers to interact with your message as well, recent studies* shows mobile email opens account for 41% of email opens. – Optimize your content for conversion, limit the number of calls to action and keep them above the fold. *http://emailblog.eu/2012/09/14/email-marketing-stats-knotice-mobile-email-opens-report-on-first-half-2012/
- 25. HOW-TO HELP IMPROVE DELIVERABILITY Code Appropriately – Do not include unsupported Flash, scripts or embedded videos in email. – Keep html tags to the minimum necessary to achieve the design objectives, excess code can land your messages in bulk or spam folders. – Use ALT text under images for better end-user experience when images are not rendered by default. – Use web-safe fonts to keep the volume of images lower and size of your emails smaller
- 26. INACTIVES
- 27. INACTIVES
- 28. JUSTIFICATION
- 29. JUSTIFICATION
- 30. JUSTIFICATION High Growth, High Efficiency High Growth, Low Efficiency Low Growth, Low Efficiency Low Growth, High Efficiency Revenue Performance Analysis (RPA) Against Industry Peers
- 31. KEYS
- 32. LEAD QUALITY
- 34. MOBILE OPTIMIZATION Optimizing HTML Emails for Mobile • Avoid using long subject lines, which will push the email content even farther down an already- small mobile screen. • Reduce the width of your emails to 640 pixels or less. The newest smartphones can zoom out on wider email but mobile-friendly widths have been shown to increase a user’s interaction and click through rate. Held in vertical orientation, most smartphones have screens between 320 and 480 pixels wide so if you email is 640 pixels wide it can be viewed on a mobile device zoomed out 25- 50%, so a subscriber gets a somewhat legible view at the email before zooming in. • Decrease the size of your email files. Mobile internet speeds are slower than desktop connections, so keep the files smaller so that they can be downloaded and viewed faster on mobile devices. Some mobile devices will require an additional click for a user to download the rest of an email when the file is too large. The optimum email weight is less than 20k. • Increase the size and padding of text link and button calls to action. When pressed against a screen, a finger covers 45 pixels. Make sure your calls to action are padded at least 10-15 pixels to avoid user frustration when trying to click through.
- 35. MOBILE OPTIMIZATION Optimizing HTML Emails for Mobile • Mobile-friendly emails mean users can click through to your website from a mobile device. When designing landing pages consider whether they are mobile friendly too? If it isn’t, subscribers will be discouraged from clicking through or taking your calls to action. • Optimize landing page widths to keep mobile-friendly, similar manner to mobile optimized emails. • Keep landing page copy brief. Save the details for another page deeper inside your site, mobile users who are looking for more information will visit from a desktop computer. • Remove flash from landing pages and instead opt for HTML5, CSS3 or JavaScript. The iPhone and iPod Touch (which represent the largest portion of mobile web traffic) don’t all support flash and neither does Blackberry. Flash is supported for Android but often has a long load time which discourages users. • Remember for touchscreen users there is no hover-over for links, if they touch they click. Make sure your calls to action are padded at least 10-15 pixels to avoid user frustration when trying to click through.
- 36. NON-COMPLIANCE
- 37. OSTRICH
- 38. THE OSTRICH EFFECT Your reputation as an email sender impacts your potential reach as a marketer. These practices can earn you a poor deliverability score, preventing your emails from reaching your desired target: • Lack of adherence to an email privacy policy • Poor list management • Frequency and relevancy of sends • Complaints from recipients • Spam trap and blacklist hits • End-user engagement with your emails • Message Content (actual copy but more so coding and technical architecture of messages)
- 39. PERSONALIZATION
- 40. QUARANTINE
- 41. RE-ENGAGEMENT
- 42. RE-ENGAGEMENT
- 43. SUBJECT LINES
- 44. TESTING
- 45. TESTING Review and Refine Generate reports that provide insight into bounces, complaints, and unsubscribes. – Keep bounce rates under 3%. Monitor bounces by contact list, by email/email batch/email groups. – Keep complaints under 0.01% by monitoring spam unsubscribes (i.e., contacts that reported your email as spam). – Keep unsubscribe rates below 1% by monitoring unsubscribe trends: • How does this email campaign’s unsubscribe rate trend against average performance? If there is a variance, pinpoint how this email differed from others in terms of list quality, content, etc. • Is my unsubscribe rate trending upward? If so, investigate a possible frequency or relevancy problem.
- 46. UNSUBSCRIBES
- 47. UNSUBSCRIBES Make Unsubscribing Clear & Easy – It may sound counter to your goals but the easier you make it for your user to find the unsubscribe link the less likely they will report you as spam instead of unsubscribing. – Unsubscribe links should never be “hidden,” not only does it increase the chances someone reports you as spam it also is a bad business practice is questionable at best in terms of CAN-SPAM compliance. – Employing a preference center that allows users to “opt-down” from subscriptions (both in terms of frequency of emails and types of communication) increases the chances you will keep a subscriber.
- 48. VOLUME
- 49. VOLUME Volume of email is another important factor to your sender reputation. Inside Eloqua and Return Path, volume is the number of emails reported by ISPs that contribute data to the Reputation Data Network maintained by Return Path. While mailing volume is not inherently good or bad, high volumes are likely to trigger tighter scrutiny by ISPs and inconsistent sending patterns or large volume spikes will trigger similar inspection. It is best to establish a cadence of sending and maintain it over time to keep a consistent volume and avoid such examination by ISPs. Frequency of sends is important in that you should keep a consistent frequency. If you have dips and spikes in your sending that are without pattern it is likely that you will appear to be a spammer to more stringent filters.
- 50. WELCOME PROGRAMS
- 51. WELCOME PROGRAMS
- 52. EXCLAMATION POINTS (and other special characters)
- 53. Y
- 54. WHY DELIVERABILITY MATTERS When your email can’t be delivered you fail to get the results or revenue: – Open Rate: 13% – Conversion From Email Open to Form Submit: 6.5% – Conversion From Form Submit to Sale: 0.5% – Number of Emails Sent: 100,000 – Number of Emails Delivered (Sent minus Bounces): 95,000 – Average Sales Price $150,000 Delivery Rate Number Received Number of Emails Opened Number of Form Conversions Number of Sales Sales Value 95% 90,250 11,733 763 4 $571,959 83% 78,850 10,251 666 3 $499,712 64% 60,800 7,904 514 3 $385,320
- 55. ZERO
- 56. ZERO TOLERANCE Today's email marketers are finding it harder and harder to be heard. As a result, you need to master deliverability and privacy to rise above "noise" from social media, other email marketers, and even new techniques like word-of- mouth marketing. Failing to monitor deliverability can cause financial harm to your company in more than one way. Internet Service Providers (ISPs) are constantly adding new systems to stop your emails, and failing to monitor and secure your deliverability is a silent killer of email marketing. In addition, legal compliance with legislation like CAN-SPAM and CASL C-28 is crucial to avoid costly fines.
- 57. NEXT STEPS
- 59. ANNUAL AVERAGE Q1 AVERAGE Q2 AVERAGE Q3 AVERAGE Q4 AVERAGE BENCHMARK Sender Score 90 93 95 98 96 90.46 FilTered Messages 6.01% 8.22% 6.94% 3.28% 9.47% 0.39% Complaints 0.45% 0.38% 0.82% 0.52% 0.11% 0.07% Volume (Hundreds of Thousands) 5.6 3.3 4.6 7.2 9.2 Sender Rejected 0.77% 0.30% 0.18% 0.28% 3.15% 0.22% Unknown Users 1.13% 0.96% 1.33% 1.65% 0.85% 0.93% Spam Traps 0 0 0 0 0 0 Blacklists 0 0 0 0 1 0 FBL Complaints 0 0 0 0 0 0 SNDS Complaints 0 0 0 0 0 0 Highlights: • Sender Score averages are consistently above benchmark Areas to Improve: • Message filtering, Sender Rejected and Complaints are substantially over benchmark numbers on a constant basis, regular testing of messages and implementation of design best practice in addition to keeping regular cadence with known audiences and warming new audiences should help keep these numbers in check for 2013 • Unknown user numbers are slightly higher than benchmark, this is only of concern when spikes in complaints and sender rejection are seen at the same time, to keep unknown user numbers low implement warming and welcome campaigns for new audience segments and implement rules for dropping inactive contacts from regular communication 2012 PERFORMANCE vs BENCHMARKS
- 60. 2012 METRICS 1.1 2.73.4 7.1 1.30.5 2.52.22.8 6.8 3.2 6.3 3.82.4 4.25.4 10.7 1.1 10.6 0.10.0 2.21.1 10.3 1.8 9.9 0.1 16.5 26.0 10.7 1.9 16.0 0.3 4.54.3 0.4 11.0 1.10.20.6 2.6 18.418.2 14.014.514.2 0.00.4 10.7 18.1 7.8 0.0 0.00% 10.00% 20.00% 30.00% 40.00% 50.00% 60.00% 0 10 20 30 40 50 60 70 80 90 100 Sender Score Volume (Hundreds of Thousands) Fitlered Messages Complaints Sender Rejected Unknown Users NRF Pre-show & Narrobanding Webinar Invite Modex Preshow Federal IP Warming LEX700 Demo & Manufacturing NurtAttrract Send 1 Retail Shopper Survey & NurtAttract Gov PA RetailMonthly Awareness eDM, Innovation Paradox to T&L, Gov Nurture, MotoTRBO Send B Retail MPOS Nurture, Wireless MESH Webinar, Gov Radio Accessories Nurture Touch 2 Promat Sends – were stopped due to high complaints, spam trap hit and blacklist hit
- 62. 0 10 20 30 40 50 60 70 80 90 100 0.00% 5.00% 10.00% 15.00% 20.00% 25.00% 30.00% 35.00% 40.00% Decreased Deliverability Impact on Open Rates Open Rate Sender Score 2012 METRICS
- 63. 0 10 20 30 40 50 60 70 80 90 100 0.00% 2.00% 4.00% 6.00% 8.00% 10.00% 12.00% Sender Score Impact on Click-Through Rates Click-Thru Rate Sender Score 2012 METRICS
- 64. 0 20 40 60 80 100 120 0.00% 2.00% 4.00% 6.00% 8.00% 10.00% 12.00% 14.00% Sender Score & Bounce Rates Hard Bounce Soft Bounce Sender Score 2012 METRICS
- 65. 7.8 20.6 11.4 14.8 11.5 37.6 14.2 10.4 3.0 14.2 0.00% 5.00% 10.00% 15.00% 20.00% 25.00% 30.00% 35.00% 40.00% 0 10 20 30 40 50 60 70 80 90 100 Dec 30 - Jan 5 Jan 6 - 12 Jan 13 - 19 Jan 20 - 26 Jan 27 - Feb 2 Feb 3 - 9 Feb 10 - 16 Feb 17 - 23 Feb 24 - Mar 2 Mar 3 - 9 Sender Score Volume (Hundreds of Thousands) Fitlered Messages Complaints Sender Rejected Unknown Users Residual impact of end of December Promat sends HIMSS invite sent to largely inactive Healthcare database High PCR volume during this week including co-branded webinar which garnered high spam complaints 2013 YTD METRICS
- 66. 2013 YTD METRICS 84 86 88 90 92 94 96 98 100 Dec 30 - Jan 5 Jan 6 - 12 Jan 13 - 19 Jan 20 - 26 Jan 27 - Feb 2 Feb 3 - 9 Feb 10 - 16 Feb 17 - 23 Feb 24 - Mar 2 Mar 3 - 9 Sender Score Sender Score