24. Char Booth [email_address] blog: info-mational - infomational.com @charbooth Paul Signorelli & Associates San Francisco, CA 415.681.5224 [email_address] paulsignorelli.com
25. Empty Shelves: From Libraryonthemove ’s photostream at http://www.flickr.com/photos/libraryonthemove/431950822/sizes/m/in/photostream/ Library Users on Computers: From Pobrecito33 ’s photostream at http://www.flickr.com/photos/38117207@N03/4349654044/sizes/m/in/photostream/ Minneapolis Public Library Interior: From Wikimedia Commons at http://commons.wikimedia.org/wiki/File:Minneapolis_Public_Library_interior.jpg Laptop: From Yum9me ’s photostream at http://www.flickr.com/photos/yum9me/3135039820/sizes/m/in/photostream/ Globe: From Cheesy42 ’s photostream at http://www.flickr.com/photos/cheesy42/4431725778/sizes/o/in/photostream/ Rutgers Law Library - Newark: From Rutgers University Libraries website at http://www.libraries.rutgers.edu/rul/libs/law_newark_lib/law_newark.shtml Colored Folders: From Asparina ’s photostream at http://www.flickr.com/photos/honey_to_the_bee/443363039/sizes/m/in/photostream/ Stack of Reports: From Kevin H. ’s photostream at http://www.flickr.com/photos/kevharb/3056726319/sizes/m/in/photostream/ Navigation Tool: From Marfis75 ’s photostream at http://www.flickr.com/photos/marfis75/5374308475/sizes/m/in/photostream/ Magnifying Glass: From Arnybo ’s photostream at http://www.flickr.com/photos/arnybo/2679622216/sizes/m/in/photostream/ Target: From Ntang ’s photostream at http://www.flickr.com/photos/ntang/21736757 Rusty Grain Silos: photographed by Char Booth in west Texas. Images taken from flickr.com unless otherwise noted
Editor's Notes
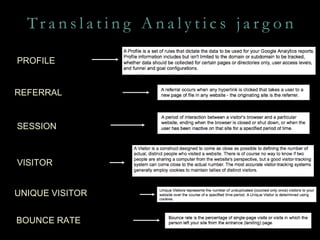
[Char] Exploring analytics jargon, part 1.
[Char] Exploring analytics jargon, part 2.
[Char] Jacqueline Lichtman, Web/Marketing Librarian at the Jefferson-Madison Regional Library provided an interesting bounce rate comparison for us that gets to the heart of what insight this particular statistic provides. First consider the bounce rate of their main site.
[Char] Bounce rate comparison: their OPAC bounce rate is much lower.
[Char] Now we’re getting into what many of you asked for last week: the specific demos of how to do specific tasks and navigate GA to get the most out of the interface. Logging in takes a google account, which can be set up with a library email address.
[Char] Creating an account is a fast and easy process.
[Char] Adding the tracking code can be difficult to do at first, but once you achieve it a few times you will get in a rhythm of locating, copying, and pasting the code. The tracking snipped itself is located in the “edit > check” section of each profile in the account overview.
[Char] Using the new asynchronous snippet, you copy/paste code before the closing </head> tag in any html editor.
[Char] There are alternative procedures for how and where to add the code in content management systems, but usually the answers are easily found in program documentation or user forums.
[Char] So now we’re going to explore the GA dashboard, which is an interface that causes people a lot of confusion. Here, I’ve labeled the eight most frequently used parts of the interface, and I’ll go through them one by one.
[Char]
[Char]
[Char]
[Char]
[Char]
[Paul] Let ’s take our last break here for your questions and your comments. Again, using the live chat box on your screen, please let us know what you’ve been doing with Google Analytics or any other web analytics tools you’ve used before we move on to our final work today: live demonstrations of some of the things we’ve been discussing. And if you have posted a question we haven’t answered, please bring it back to our attention now.
[Paul] Now, let’s return to the example we used in the previous session, that of tracking the mobile user shift using analytics. In a moment, Char will jump into an analytics account and show you where and how to view this type of information using the left-hand dashboard menu in the visitors section.
Remember the scenario outlined in the last session, wherein Google Analytics showed us how mobile devices are increasing in use in this particular library?
Here’s an example of how to gather even more useful information about the mobile shift: comparing two years of use via mobile devices. Let’s look at this example of a pdf report generated form the GA dashboard. Later during the live demonstration we’ll show you how we found this information, and will go more in-depth into understanding how to create and interpret Analytics reports . Notice that there was very little mobile activity prior to midway through 2009, then a steady rise after that. Notice also the change in device use – there is huge growth in iPad access.
[Char] One GA meta-account should be created to rule them all. Use profiles and filters or tracking code modifications rather than multiple accounts to track different parts of your site – this makes it harder for the data to interact and produce reliable results.
[Paul] Before Char starts in with her demo, this is a reminder that the help articles, videos, glossary, and forums in Google Analytics are a must-use for those who need to learn specific actions, and/or individuals just getting started with the tracking and analysis process.
[Char]
As we did last week, we want to leave you with a few resources in case you want to dive in further. The WebAnalyticsLand site, shown in the upper right-hand corner of this slide, is one we previously recommended, and it has plenty that is applicable to what we explored today. Brian Clifton’s fabulous book Advanced Web Metrics with Google Analytics—now available in a second edition and shown here in the lower left-hand corner—is full of the sort of hands-on information you requested and which we’ve led you through today. And, to give you an ongoing fresh source of information, Clifton’s “Measuring Success,” which is billed as the “official blog for his book, should keep all of us going for months to come. We ’ ll leave these up for you while we answer any remaining questions you have.