Vancouver Real Estate December 2012 Stats Package REBGV
•
0 gostou•377 visualizações

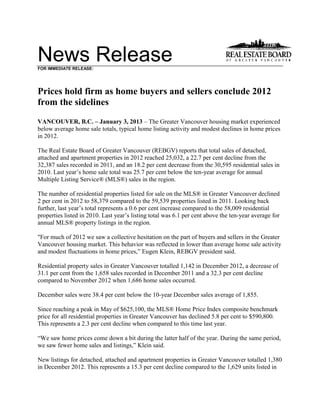
VANCOUVER, B.C. – January 3, 2013 – The Greater Vancouver housing market experienced below average home sale totals, typical home listing activity and modest declines in home prices in 2012.

Recomendados
Recomendados
Mais conteúdo relacionado
Mais procurados
Mais procurados (13)
Destaque
Destaque (20)
Semelhante a Vancouver Real Estate December 2012 Stats Package REBGV
Semelhante a Vancouver Real Estate December 2012 Stats Package REBGV (19)
Mais de Matt Collinge
Mais de Matt Collinge (20)
Último
Último (20)
Vancouver Real Estate December 2012 Stats Package REBGV
- 1. News Release FOR IMMEDIATE RELEASE: Prices hold firm as home buyers and sellers conclude 2012 from the sidelines VANCOUVER, B.C. – January 3, 2013 – The Greater Vancouver housing market experienced below average home sale totals, typical home listing activity and modest declines in home prices in 2012. The Real Estate Board of Greater Vancouver (REBGV) reports that total sales of detached, attached and apartment properties in 2012 reached 25,032, a 22.7 per cent decline from the 32,387 sales recorded in 2011, and an 18.2 per cent decrease from the 30,595 residential sales in 2010. Last year’s home sale total was 25.7 per cent below the ten-year average for annual Multiple Listing Service® (MLS®) sales in the region. The number of residential properties listed for sale on the MLS® in Greater Vancouver declined 2 per cent in 2012 to 58,379 compared to the 59,539 properties listed in 2011. Looking back further, last year’s total represents a 0.6 per cent increase compared to the 58,009 residential properties listed in 2010. Last year’s listing total was 6.1 per cent above the ten-year average for annual MLS® property listings in the region. "For much of 2012 we saw a collective hesitation on the part of buyers and sellers in the Greater Vancouver housing market. This behavior was reflected in lower than average home sale activity and modest fluctuations in home prices,” Eugen Klein, REBGV president said. Residential property sales in Greater Vancouver totalled 1,142 in December 2012, a decrease of 31.1 per cent from the 1,658 sales recorded in December 2011 and a 32.3 per cent decline compared to November 2012 when 1,686 home sales occurred. December sales were 38.4 per cent below the 10-year December sales average of 1,855. Since reaching a peak in May of $625,100, the MLS® Home Price Index composite benchmark price for all residential properties in Greater Vancouver has declined 5.8 per cent to $590,800. This represents a 2.3 per cent decline when compared to this time last year. “We saw home prices come down a bit during the latter half of the year. During the same period, we saw fewer home sales and listings,” Klein said. New listings for detached, attached and apartment properties in Greater Vancouver totalled 1,380 in December 2012. This represents a 15.3 per cent decline compared to the 1,629 units listed in
- 2. December 2011 and a 50 per cent decline compared to November 2012 when 2,758 properties were listed. Sales of detached properties in December 2012 reached 425, a decrease of 32.5 per cent from the 630 detached sales recorded in December 2011, and a 44.7 per cent decrease from the 769 units sold in December 2010. The benchmark price for detached properties decreased 2.7 per cent from December 2011 to $904,200. Since reaching a peak in May, the benchmark price of a detached property has declined 6.5%. Sales of apartment properties reached 504 in December 2012, a decline of 34.9 per cent compared to the 774 sales in December 2011, and a decrease of 37.9 per cent compared to the 811 sales in December 2010.The benchmark price of an apartment property decreased 1.9 per cent from December 2011 to $361,200. Since reaching a peak in May, the benchmark price of an apartment property has declined 12.8%. Attached property sales in December 2012 totalled 213, a decline of 16.1 per cent compared to the 254 sales in December 2011, and a 33.2 per cent decrease from the 319 attached properties sold in December 2010. The benchmark price of an attached unit decreased 2.6 per cent between December 2011 and 2012 to $450,900. Since reaching a peak in April, the benchmark price of an attached property has declined 4.4%. “Activity continues to vary depending on area so it’s important to work with your REALTOR® and other professionals to understand the trends in your area of interest,” Klein said. -30- The real estate industry is a key economic driver in British Columbia. In 2012, 32,390 homes changed ownership in the Board's area, generating $1.36 billion in spin-off activity and 9,069 jobs. The total dollar value of residential sales transacted through the MLS® system in Greater Vancouver totalled $25 billion in 2012. The Real Estate Board of Greater Vancouver is an association representing more than 11,000 REALTORS® and their companies. The Board provides a variety of member services, including the Multiple Listing Service®. For more information on real estate, statistics, and buying or selling a home, contact a local REALTOR® or visit www.rebgv.org. For more information please contact: Fiona Youatt, Communication Coordinator Real Estate Board of Greater Vancouver Phone: (604) 730-3068 E-mail: fyouatt@rebgv.org
- 3. * December 2012 Benchmark Price 1 Month 3 Month 6 Month 1 Year 3 Year 5 Year Property Type Area Price Index Change % Change % Change % Change % Change % Change % Residential / Composite Lower Mainland $532,400 150.3 -1.1% -2.5% -4.2% -1.6% 5.5% 5.2% Greater Vancouver $590,800 154.9 -1.0% -2.5% -4.8% -2.3% 6.3% 7.6% Bowen Island $560,000 121.4 -2.4% -5.5% -10.3% -0.4% -8.5% -10.7% Burnaby East $551,000 152.1 0.0% -2.4% -3.6% -1.2% 4.8% 6.0% Burnaby North $503,200 150.3 -0.5% -1.2% -4.8% -1.8% 4.2% 5.5% Burnaby South $560,800 158.1 -0.9% -2.6% -3.9% -1.6% 8.5% 11.7% Coquitlam $497,700 147.2 -0.7% -1.9% -2.7% 1.3% 6.1% 4.2% Ladner $515,900 143.5 0.3% -4.1% -6.5% -2.5% 4.1% 5.2% Maple Ridge $391,400 132.3 0.7% -0.2% -0.2% 0.7% 0.2% -4.0% New Westminster $354,400 152.1 -1.2% -3.3% -4.8% -0.8% 2.7% 2.4% North Vancouver $624,500 141.3 -2.4% -4.9% -5.4% -1.8% 2.3% 1.6% Pitt Meadows $388,000 140.5 0.1% 2.3% 2.8% 2.6% 3.8% -0.2% Port Coquitlam $395,400 140.4 -0.1% -0.8% -2.3% -1.3% -0.4% -2.1% Port Moody $502,200 138.7 -2.0% -1.9% -2.1% 3.0% 1.7% -1.3% Richmond $561,300 163.0 -1.5% -1.4% -4.8% -5.3% 7.9% 14.6% Squamish $387,700 125.2 0.5% -5.2% -4.2% 2.0% 1.6% -4.1% Sunshine Coast $340,500 119.3 -3.6% -7.1% -8.4% -6.3% -10.2% -12.5% Tsawwassen $585,700 147.6 -0.6% -2.5% -5.0% -0.7% 8.0% 6.8% Vancouver East $600,200 175.6 -0.8% -1.5% -3.5% 1.1% 13.1% 18.1% Vancouver West $780,100 164.4 -1.1% -1.6% -5.2% -2.8% 7.8% 9.7% West Vancouver $1,503,400 161.4 0.1% -4.2% -8.6% -2.1% 18.6% 11.7% Whistler $457,500 109.0 0.9% -4.5% -6.7% -1.7% -7.5% -16.5% Single Family Detached Lower Mainland $741,600 157.6 -1.1% -2.8% -4.7% -1.4% 12.3% 12.9% Greater Vancouver $904,200 167.1 -1.1% -3.4% -6.0% -2.7% 14.9% 18.0% Bowen Island $560,000 121.4 -2.4% -5.5% -10.3% -0.3% -8.5% -10.7% Burnaby East $713,700 159.6 -0.7% -5.0% -6.2% -1.7% 9.5% 14.1% Burnaby North $895,800 172.9 -1.5% -1.6% -5.6% -0.3% 17.6% 22.0% Burnaby South $951,000 182.3 -2.6% -5.2% -6.2% 0.4% 23.9% 31.2% Coquitlam $701,000 155.3 -0.6% -1.8% -3.0% 2.9% 12.2% 12.0% Ladner $595,100 143.6 0.6% -4.4% -7.1% -3.2% 5.0% 6.2% Maple Ridge $463,400 131.7 0.9% -1.1% -0.6% 1.2% 1.5% -2.5% New Westminster $639,700 158.7 -0.9% -4.8% -6.3% -2.0% 9.4% 13.8% North Vancouver $908,500 145.0 -2.4% -5.5% -7.1% -3.7% 5.5% 5.5% Pitt Meadows $499,900 139.5 -0.6% -0.4% -0.3% -0.3% 2.9% 1.2% Port Coquitlam $551,500 147.3 -0.3% -0.8% -2.4% 1.4% 6.4% 6.8% Port Moody $816,100 151.2 -2.1% -4.1% -3.3% 1.7% 9.8% 7.5% Richmond $938,100 188.9 -1.8% -2.6% -6.1% -6.5% 21.2% 32.1% Squamish $483,500 130.6 -0.1% -4.9% -3.8% -3.5% 1.3% 0.7% Sunshine Coast $339,100 118.8 -3.7% -7.2% -8.3% -6.5% -10.5% -12.8% Tsawwassen $705,900 152.0 -0.8% -2.5% -4.7% -0.5% 12.8% 9.8% Vancouver East $829,200 183.1 -0.7% -2.5% -4.1% 0.2% 20.8% 28.3% Vancouver West $2,004,000 205.9 -1.2% -4.1% -9.1% -5.5% 23.6% 30.9% West Vancouver $1,778,100 169.3 0.3% -3.8% -8.6% -1.5% 24.1% 17.4% Whistler $890,000 123.2 1.5% 4.9% 8.0% 4.9% -2.1% -7.6% HOW TO READ THE TABLE: • Benchmark Price: Estimated sale price of a benchmark property. Benchmarks represent a typical property within each market. • Price Index: Index numbers estimate the percentage change in price on typical and constant quality properties over time. All figures are based on past sales. • x Month/Year Change %: Percentage change of index over a period of x month(s)/year(s) * In January 2005, the indexes are set to 100. Townhome properties are similar to Attached properties, a category that was used in the previous MLSLink HPI, but do not included duplexes. The above info is deemed reliable, but is not guaranteed. All dollar amounts in CDN. * MLS®, Multiple Listing Service®, and all related graphics are trademarks of The Canadian Real Estate Association 1 of 10
- 4. * December 2012 Benchmark Price 1 Month 3 Month 6 Month 1 Year 3 Year 5 Year Property Type Area Price Index Change % Change % Change % Change % Change % Change % Townhouse Lower Mainland $386,200 140.2 -0.8% -1.6% -3.5% -2.6% 1.5% 0.8% Greater Vancouver $450,900 146.3 -0.7% -1.7% -3.8% -2.6% 3.5% 4.9% Burnaby East $406,800 145.9 -1.8% -3.1% -3.6% -3.4% 2.2% 4.9% Burnaby North $382,900 142.8 -0.6% -2.7% -4.5% -8.5% 1.1% 1.5% Burnaby South $410,000 147.1 -1.4% -1.9% -3.2% -3.1% 3.4% 7.1% Coquitlam $386,600 142.0 -0.6% 0.9% 1.0% 3.0% 4.1% 2.7% Ladner $430,100 142.5 -1.0% -4.3% -4.7% -2.7% 2.8% 1.8% Maple Ridge $267,600 130.0 -1.1% -1.7% -2.9% -3.5% -4.8% -7.5% New Westminster $381,200 143.2 -0.7% -3.4% -5.0% -0.6% 4.7% 4.0% North Vancouver $566,100 135.5 -1.7% -1.7% -5.0% -3.5% 0.2% 0.7% Pitt Meadows $323,300 139.9 -2.6% -1.3% 0.4% -0.5% 4.5% 0.4% Port Coquitlam $369,300 140.6 -0.2% 0.6% -0.9% -1.6% 0.1% -1.3% Port Moody $409,000 138.2 -1.1% -0.7% -0.4% 2.9% 1.2% -2.1% Richmond $488,100 157.8 -0.9% -1.7% -3.2% -4.1% 7.8% 13.9% Squamish $335,600 121.8 2.3% -5.1% -3.7% 11.0% 1.2% -4.6% Tsawwassen $440,800 136.3 -1.5% -3.5% -6.6% -4.2% -1.7% -2.6% Vancouver East $512,600 169.0 2.6% 1.5% -1.7% 2.4% 11.0% 13.3% Vancouver West $663,600 150.1 -2.3% -1.3% -6.9% -3.0% 3.2% 6.8% Whistler $450,300 121.3 1.5% -2.6% -3.8% 12.7% 9.1% -3.6% Apartment Lower Mainland $331,000 145.2 -1.1% -2.2% -3.8% -1.4% -1.4% -2.7% Greater Vancouver $361,200 146.0 -1.0% -2.0% -4.0% -1.9% -0.9% -1.3% Burnaby East $378,300 143.6 5.8% 7.2% 3.2% 6.1% -4.4% -9.7% Burnaby North $327,900 138.6 0.1% -0.3% -3.8% -0.1% -3.3% -3.7% Burnaby South $369,100 148.2 0.4% -0.7% -2.8% -2.6% 1.5% 2.4% Coquitlam $248,900 137.0 -0.9% -3.2% -3.7% -1.9% -2.3% -6.5% Ladner $303,000 143.6 0.3% -3.1% -6.7% -3.8% 1.3% 4.7% Maple Ridge $191,100 139.3 2.3% 6.7% 6.8% 5.4% 2.1% -6.2% New Westminster $263,600 150.7 -1.4% -2.7% -4.1% -0.5% 0.2% -1.2% North Vancouver $339,100 137.7 -2.8% -5.5% -3.7% 0.7% -1.4% -3.4% Pitt Meadows $241,300 142.6 3.7% 9.9% 10.5% 11.6% 4.5% -4.0% Port Coquitlam $220,300 130.6 0.2% -2.1% -3.3% -4.9% -9.8% -14.0% Port Moody $311,700 129.9 -2.8% -0.9% -2.3% 3.8% -4.3% -7.0% Richmond $334,000 141.6 -1.7% -0.2% -4.6% -5.5% -5.6% -1.7% Squamish $239,600 115.3 -0.6% -7.5% -7.3% 7.5% 0.3% -14.7% Tsawwassen $324,500 136.5 0.3% -2.6% -5.7% -3.1% -3.7% -0.5% Vancouver East $303,400 167.4 -1.6% -0.7% -3.2% 1.9% 3.8% 6.1% Vancouver West $463,700 150.1 -1.0% -0.4% -2.8% -1.3% 0.9% 0.9% West Vancouver $583,100 127.4 -1.2% -6.7% -8.0% -5.6% -5.6% -12.6% Whistler $225,300 80.9 -0.7% -6.7% -11.7% -9.9% -32.4% -39.1% HOW TO READ THE TABLE: • Benchmark Price: Estimated sale price of a benchmark property. Benchmarks represent a typical property within each market. • Price Index: Index numbers estimate the percentage change in price on typical and constant quality properties over time. All figures are based on past sales. • x Month/Year Change %: Percentage change of index over a period of x month(s)/year(s) In January 2005, the indexes are set to 100. * Townhome properties are similar to attached properties, a category that was used in the previous MLSLink HPI, but do not included duplexes. Lower Mainland includes areas serviced by both Real Estate Board of Greater Vancouver & Fraser Valley Real Estate Board. The above info is deemed reliable, but is not guaranteed. All dollar amounts in CDN. * MLS®, Multiple Listing Service®, and all related graphics are trademarks of The Canadian Real Estate Association 2 of 10
- 5. Dec 2012 Oct 2012 Aug 2012 Jun 2012 Apr 2012 Feb 2012 Dec 2011 Oct 2011 Apartment Aug 2011 Jun 2011 Apr 2011 Feb 2011 Dec 2010 Townhouse Greater Vancouver Oct 2010 5 Year Trend Aug 2010 Jun 2010 Apr 2010 Detached Feb 2010 Dec 2009 Oct 2009 Aug 2009 Residential Jun 2009 Apr 2009 C:DATAMonthEndHpiexporthi_resgv-hpi2.tif Feb 2009 Dec 2008 Oct 2008 Aug 2008 Jun 2008 Jan 2005 HPI = 100 Apr 2008 Feb 2008 Dec 2007 90 190 180 170 160 150 140 130 120 110 100 Price Index
- 6. 12 19 2012 MLS® SALES Facts Sound dows owe er itt Mea st elcarra est m ast ast berton uver ouver/H December y - Gulf ish estmin lam Ridge/P oody/B ond ine Co South oquitla uver E uver W Vanco er/Pem 2012 t Vanc Burnab Vanco Vanco Wes Coquit Maple New W North Port C Port M Richm Squam Sunsh Whistl Delta - Islands Detached 38 51 10 5 42 10 32 22 10 44 10 12 54 49 29 7 425 Number of Attached 29 10 1 0 16 5 24 10 11 40 5 1 17 30 1 13 213 December Sales Apartment 77 20 4 0 16 32 34 23 11 54 3 2 53 156 8 11 504 2012 Detached $897,500 $686,000 n/a n/a $480,000 n/a $925,000 $532,500 n/a $1,080,000 n/a n/a $808,500 $1,730,750 $2,033,000 n/a Median Selling Attached $457,000 n/a n/a n/a n/a n/a $610,000 n/a n/a $495,000 n/a n/a n/a $837,000 n/a n/a n/a Price Apartment $333,500 $282,450 n/a n/a n/a $314,500 $348,500 $219,500 n/a $318,000 n/a n/a $325,000 $468,000 n/a n/a Detached 49 60 24 1 58 11 60 22 15 76 13 30 91 77 32 10 629 Number of Attached 34 22 4 0 16 15 25 16 15 50 12 0 35 40 3 20 307 November Sales Apartment 102 40 13 0 32 54 59 21 12 81 7 4 69 241 8 7 750 2012 Detached $845,000 $725,000 $633,500 n/a $475,750 n/a $905,000 $499,000 n/a $1,070,000 n/a $365,000 $869,000 $1,878,000 $1,432,500 n/a Median Selling Attached $490,000 $434,950 n/a n/a n/a n/a $605,000 n/a n/a $494,750 n/a n/a $598,000 $908,500 n/a $512,000 n/a Price Apartment $361,000 $273,250 n/a n/a $259,950 $278,500 $375,000 $217,000 n/a $320,000 n/a n/a $339,800 $468,500 n/a n/a Detached 65 84 18 0 72 6 53 16 14 62 12 23 95 62 38 10 630 Number of Attached 40 21 7 0 21 6 17 16 18 41 7 1 15 31 0 13 254 December Sales Apartment 104 44 9 0 37 62 62 18 18 75 6 2 51 262 11 13 774 2011 Detached $895,000 $719,900 n/a n/a $490,000 n/a $982,000 n/a n/a $965,000 n/a $370,000 $823,500 $2,075,000 $1,600,000 n/a Median Selling Attached $478,950 $485,000 n/a n/a $286,000 n/a n/a n/a n/a $499,000 n/a n/a n/a $750,000 n/a n/a n/a Price Apartment $322,175 $329,000 n/a n/a $205,900 $295,000 $380,000 n/a n/a $346,000 n/a n/a $320,500 $474,000 n/a n/a Detached 818 1,067 429 37 1,049 268 920 390 188 976 181 470 1,267 1,243 609 107 10,019 Number of Attached 667 374 63 1 367 128 307 223 197 732 97 38 362 536 64 232 4,388 Jan. - Sales Apartment 1,434 665 124 0 305 749 761 289 219 1,101 45 54 1,148 3,417 159 155 10,625 Dec. 2012 Detached $917,750 $735,000 $669,800 $350,000 $479,000 $661,000 $988,000 $541,500 $784,000 $986,500 $500,000 $397,900 $867,750 $2,060,000 $1,852,000 $975,000 Median Selling Attached $474,000 $461,750 $450,000 n/a $293,000 $422,500 $637,000 $385,000 $435,000 $519,000 $357,627 $280,750 $625,000 $860,000 $1,195,000 $556,000 n/a Year-to-date Price Apartment $365,000 $283,000 $322,500 n/a $216,000 $305,000 $375,000 $238,000 $332,000 $332,800 $251,000 $266,250 $345,000 $480,000 $710,000 $229,000 Detached 1,282 1,339 592 34 1,148 329 1,191 453 234 1,707 188 451 1,819 1,986 1,163 113 14,029 Number of Attached 861 523 87 1 485 132 386 237 246 1,013 90 41 411 733 60 167 5,473 Jan. - Sales Apartment 1,827 714 149 0 313 886 895 294 279 1,542 40 53 1,156 4,421 209 107 12,885 Dec. 2011 Detached $898,000 $709,000 $660,000 $595,000 $481,759 $630,000 $930,000 $542,650 $786,250 $990,000 $490,000 $392,000 $825,000 $2,075,000 $1,780,000 $845,000 Median Selling Attached $488,500 $456,000 $436,000 n/a $304,000 $410,750 $635,000 $390,000 $427,000 $540,650 $353,710 $272,500 $600,000 $860,000 $1,119,500 $555,000 n/a Year-to-date Price Apartment $352,750 $294,500 $336,000 n/a $215,000 $301,000 $365,000 $240,000 $335,000 $350,400 $239,500 $300,000 $342,500 $485,000 $730,000 $235,000 Note: Median Selling Prices are not reported for areas with less than 20 sales or for the Gulf Islands
- 7. 12 19 2012 MLS® LISTINGS Facts Sound dows owe er itt Mea st elcarra est m ast ast berton uver ouver/H December y - Gulf ish estmin lam Ridge/P oody/B ond ine Co South oquitla uver E uver W Vanco er/Pem 2012 t Vanc Burnab Coquit Maple North Port C Port M Richm Squam Sunsh Vanco Vanco Wes New W Whistl Delta - Islands Detached 37 54 10 6 44 7 29 11 8 82 10 37 62 96 40 18 551 Number of Attached 32 30 0 0 12 9 6 12 4 45 5 3 14 25 5 31 233 December Listings Apartment 64 40 6 0 29 45 43 19 9 94 4 6 51 153 7 26 596 2012 Detached 103% 94% 100% 83% 95% 143% 110% 200% 125% 54% 100% 32% 87% 51% 73% 39% % Sales to Attached 91% 33% n/a n/a 133% 56% 400% 83% 275% 89% 100% 33% 121% 120% 20% 42% n/a Listings Apartment 120% 50% 67% n/a 55% 71% 79% 121% 122% 57% 75% 33% 104% 102% 114% 42% Detached 99 94 25 9 92 18 87 22 19 139 24 50 111 159 72 20 1,040 Number of Attached 69 35 2 0 48 7 30 35 18 93 12 15 52 67 5 20 508 November Listings Apartment 158 81 13 0 49 81 81 32 24 145 3 5 102 387 17 32 1,210 2012 Detached 49% 64% 96% 11% 63% 61% 69% 100% 79% 55% 54% 60% 82% 48% 44% 50% % Sales to Attached 49% 63% 200% n/a 33% 214% 83% 46% 83% 54% 100% 0% 67% 60% 60% 100% n/a Listings Apartment 65% 49% 100% n/a 65% 67% 73% 66% 50% 56% 233% 80% 68% 62% 47% 22% Detached 66 62 17 6 55 10 32 16 11 85 12 25 75 89 35 26 622 Number of Attached 38 20 3 0 15 2 10 12 9 55 8 4 6 26 5 24 237 December Listings Apartment 103 54 10 0 18 58 49 22 10 102 10 12 62 218 8 34 770 2011 Detached 98% 135% 106% 0% 131% 60% 166% 100% 127% 73% 100% 92% 127% 70% 109% 38% % Sales to Attached 105% 105% 233% n/a 140% 300% 170% 133% 200% 75% 88% 25% 250% 119% 0% 54% n/a Listings Apartment 101% 81% 90% n/a 206% 107% 127% 82% 180% 74% 60% 17% 82% 120% 138% 38% Detached 2,145 2,104 785 143 2,273 481 1,879 716 456 3,334 460 1,241 2,736 3,598 1,702 344 24,397 Number of Attached 1,395 773 120 2 734 245 637 426 373 1,678 234 120 756 1,322 171 409 9,395 Jan. - Listings Apartment 3,328 1,597 267 0 651 1,628 1,766 611 529 2,885 191 126 2,238 7,974 387 409 24,587 Dec. 2012 Detached 38% 51% 55% 26% 46% 56% 49% 54% 41% 29% 39% 38% 46% 35% 36% 31% % Sales to Attached 48% 48% 53% 50% 50% 52% 48% 52% 53% 44% 41% 32% 48% 41% 37% 57% n/a Listings Year-to-date* Apartment 43% 42% 46% n/a 47% 46% 43% 47% 41% 38% 24% 43% 51% 43% 41% 38% Detached 2,075 2,195 852 160 2,259 476 1,799 706 466 3,688 459 1,187 2,899 3,589 1,975 340 25,125 Number of Attached 1,399 844 128 4 746 202 595 390 404 1,924 206 92 657 1,340 120 474 9,525 Jan. - Listings Apartment 3,158 1,517 254 10 658 1,549 1,712 707 603 3,110 245 181 2,095 8,302 368 420 24,889 Dec. 2011 Detached 62% 61% 69% 21% 51% 69% 66% 64% 50% 46% 41% 38% 63% 55% 59% 33% % Sales to Attached 62% 62% 68% 25% 65% 65% 65% 61% 61% 53% 44% 45% 63% 55% 50% 35% n/a Listings Year-to-date* Apartment 58% 47% 59% 0% 48% 57% 52% 42% 46% 50% 16% 29% 55% 53% 57% 25% * Year-to-date listings represent a cumulative total of listings rather than total active listings.
- 8. Listing & Sales Activity Summary Listings Sales 1 2 3 Col. 2 & 3 5 6 7 Col. 6 & 7 9 10 Col. 9 & 10 Dec Nov Dec Percentage Dec Nov Dec Percentage Oct 2011 - Oct 2012 - Percentage 2011 2012 2012 Variance 2011 2012 2012 Variance Dec 2011 Dec 2012 Variance BURNABY % % % DETACHED 66 99 37 -62.6 65 49 38 -22.4 242 143 -40.9 ATTACHED 38 69 32 -53.6 40 34 29 -14.7 183 121 -33.9 APARTMENTS 103 158 64 -59.5 104 102 77 -24.5 346 301 -13.0 COQUITLAM DETACHED 62 94 54 -42.6 84 60 51 -15.0 258 179 -30.6 ATTACHED 20 35 30 -14.3 21 22 10 -54.5 83 52 -37.3 APARTMENTS 54 81 40 -50.6 44 40 20 -50.0 156 112 -28.2 DELTA DETACHED 17 25 10 -60.0 18 24 10 -58.3 79 68 -13.9 ATTACHED 3 2 0 -100.0 7 4 1 -75.0 18 8 -55.6 APARTMENTS 10 13 6 -53.8 9 13 4 -69.2 30 27 -10.0 MAPLE RIDGE/PITT MEADOWS DETACHED 55 92 44 -52.2 72 58 42 -27.6 250 189 -24.4 ATTACHED 15 48 12 -75.0 21 16 16 0.0 97 61 -37.1 APARTMENTS 18 49 29 -40.8 37 32 16 -50.0 93 78 -16.1 NORTH VANCOUVER DETACHED 32 87 29 -66.7 53 60 32 -46.7 221 170 -23.1 ATTACHED 10 30 6 -80.0 17 25 24 -4.0 87 74 -14.9 APARTMENTS 49 81 43 -46.9 62 59 34 -42.4 228 149 -34.6 NEW WESTMINSTER DETACHED 10 18 7 -61.1 6 11 10 -9.1 55 47 -14.5 ATTACHED 2 7 9 28.6 6 15 5 -66.7 22 29 31.8 APARTMENTS 58 81 45 -44.4 62 54 32 -40.7 192 136 -29.2 PORT MOODY/BELCARRA DETACHED 11 19 8 -57.9 14 15 10 -33.3 50 32 -36.0 ATTACHED 9 18 4 -77.8 18 15 11 -26.7 71 37 -47.9 APARTMENTS 10 24 9 -62.5 18 12 11 -8.3 62 37 -40.3 PORT COQUITLAM DETACHED 16 22 11 -50.0 16 22 22 0.0 90 76 -15.6 ATTACHED 12 35 12 -65.7 16 16 10 -37.5 52 45 -13.5 APARTMENTS 22 32 19 -40.6 18 21 23 9.5 65 59 -9.2 RICHMOND DETACHED 85 139 82 -41.0 62 76 44 -42.1 269 199 -26.0 ATTACHED 55 93 45 -51.6 41 50 40 -20.0 180 151 -16.1 APARTMENTS 102 145 94 -35.2 75 81 54 -33.3 264 220 -16.7 SUNSHINE COAST DETACHED 25 50 37 -26.0 23 30 12 -60.0 89 88 -1.1 ATTACHED 4 15 3 -80.0 1 0 1 100.0 4 6 50.0 APARTMENTS 12 5 6 20.0 2 4 2 -50.0 8 11 37.5 SQUAMISH DETACHED 12 24 10 -58.3 12 13 10 -23.1 48 37 -22.9 ATTACHED 8 12 5 -58.3 7 12 5 -58.3 19 21 10.5 APARTMENTS 10 3 4 33.3 6 7 3 -57.1 10 13 30.0 VANCOUVER EAST DETACHED 75 111 62 -44.1 95 91 54 -40.7 333 238 -28.5 ATTACHED 6 52 14 -73.1 15 35 17 -51.4 82 73 -11.0 APARTMENTS 62 102 51 -50.0 51 69 53 -23.2 251 192 -23.5 VANCOUVER WEST DETACHED 89 159 96 -39.6 62 77 49 -36.4 303 230 -24.1 ATTACHED 26 67 25 -62.7 31 40 30 -25.0 124 119 -4.0 APARTMENTS 218 387 153 -60.5 262 241 156 -35.3 949 661 -30.3 WHISTLER DETACHED 26 20 18 -10.0 10 10 7 -30.0 31 26 -16.1 ATTACHED 24 20 31 55.0 13 20 13 -35.0 46 55 19.6 APARTMENTS 34 32 26 -18.8 13 7 11 57.1 40 33 -17.5 WEST VANCOUVER/HOWE SOUND DETACHED 35 72 40 -44.4 38 32 29 -9.4 194 112 -42.3 ATTACHED 5 5 5 0.0 0 3 1 -66.7 12 6 -50.0 APARTMENTS 8 17 7 -58.8 11 8 8 0.0 38 28 -26.3 GRAND TOTALS DETACHED 616 1031 545 -47.1 630 628 420 -33.1 2512 1834 -27.0 ATTACHED 237 508 233 -54.1 254 307 213 -30.6 1080 858 -20.6 APARTMENTS 770 1210 596 -50.7 774 750 504 -32.8 2732 2057 -24.7
- 9. Residential Average Sale Prices - January 1977 to December 2012 DETACHED CONDOMINIUM ATTACHED APARTMENTS IN THOUSANDS ($) 1400 $1,078,495 1200 1000 800 $557,966 600 400 $415,991 200 0 1977 1978 1979 1980 1981 1982 1983 1984 1985 1986 1987 1988 1989 1990 1991 1992 1993 1994 1995 1996 1997 1998 1999 2000 2001 2002 2003 2004 2005 2006 2007 2008 2009 2010 2011 2012 NOTE: From 1977 - 1984 condominium averages were not separated into attached & apartment.